Seaver Wang Profile picture
Sep 22, 2020 14 tweets 4 min read Read on X
This study is generating buzz + looked fascinating, so I read the press release, media briefing + full report yesterday.

Key findings are probably approximately correct, but these results were guaranteed given the methodology used. (THREAD)
The authors use a top-down approach to assign a country’s total emissions (private + govt) to each household based on a monotonic relationship proportional to household income, using the national income distribution and Global Carbon Proj carbon emissions data for each year. (1)
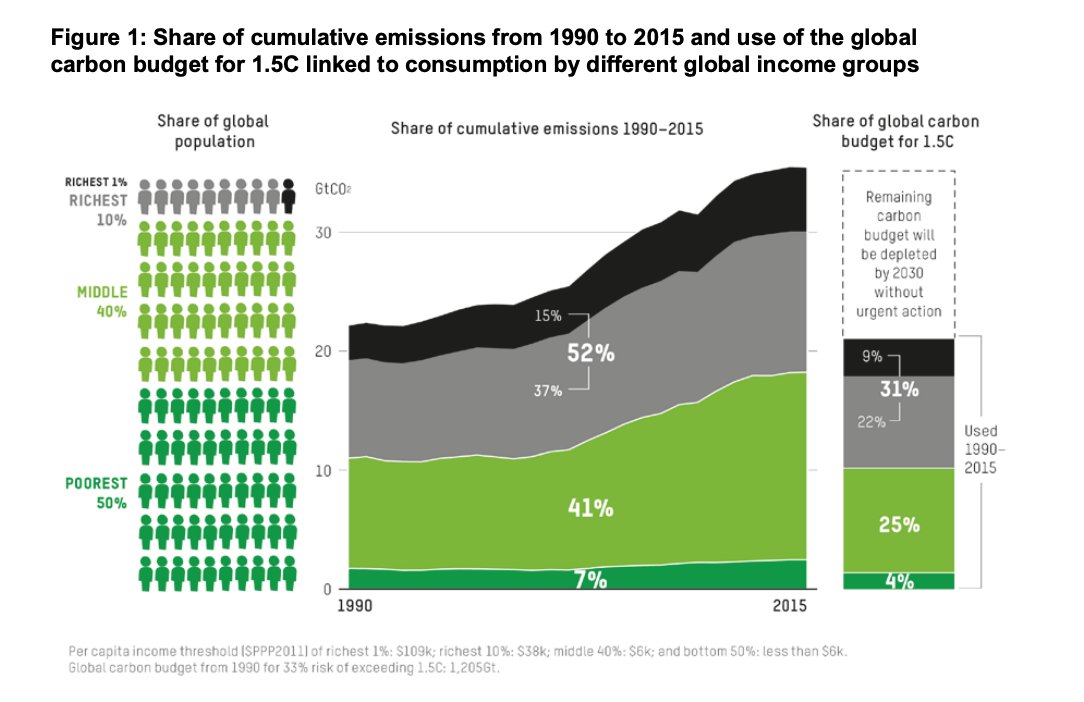
In other words, the study is virtually hard-coded to allocate more emissions to households with higher incomes, irregardless of actual consumption patterns. To be fair, relationship btwn income + emissions is generally borne out by consumer habit surveys, but… (2)
...it’s important to note that this study uses an explicit assumption that emissions are directly proportional to income to find that the global wealthy emit more - which is a guaranteed outcome on any country/planet with high income inequality. (3)
Again, the emissions vs income assumption is probably roughly correct, although there will be differences by country on the elasticity of emissions with increasing income that the Oxfam study largely declined to consider. (4)

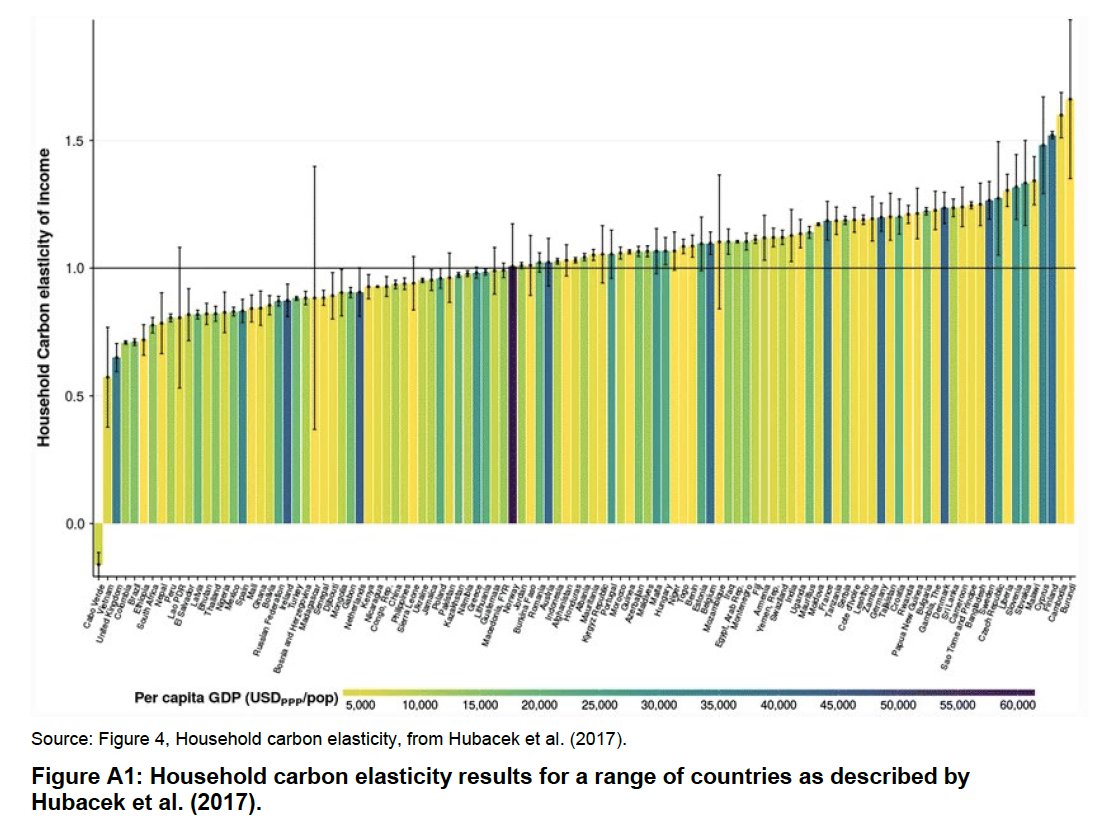
(Figure from Appendix A of the report)
But there is a difference between this top-down approach with a guaranteed result and a bottom-up study that directly evaluates the emissions associated with consumption habits of households with different incomes. The latter is of course much, much harder to conduct. (5)
My point is that this study doesn’t tell us anything we didn’t already know, and doesn’t actually provide any additional proof, since the methodology basically assumes the answer to the research question. (6)
Since the per-capita emissions figures are directly tied to income, this study is really in essence a commentary on extreme wealth and income inequality.

Which is an injustice that we absolutely need to solve, for the record. (7)
This study would have been more valuable had it considered varying elasticity of emissions with income by country, and also considered emissions contributions based on real income thresholds rather than percentiles. (8)
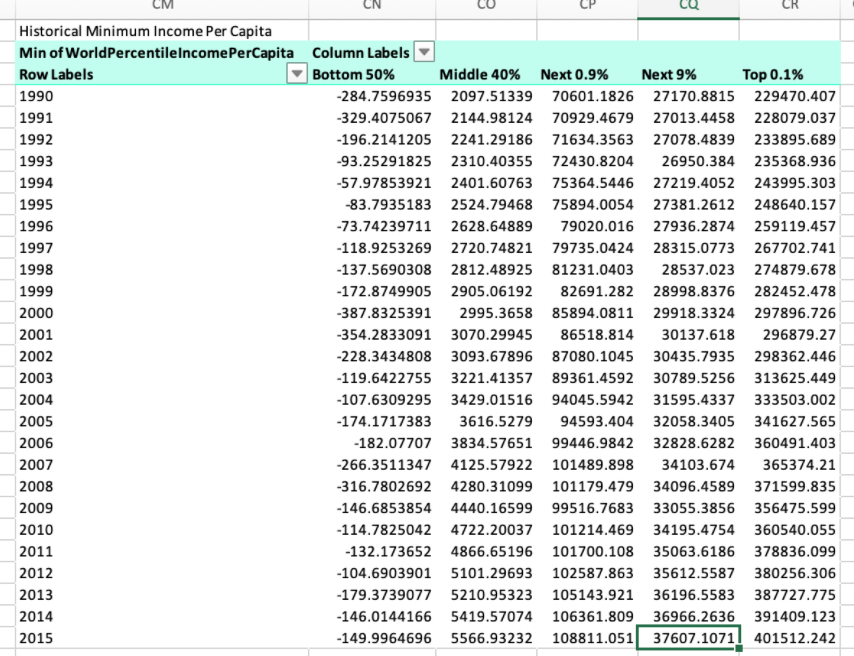
As it is, the report has to grapple awkwardly with the fact that the richest 10% and middle 40% globally grow from 533 to 738 million and 2.13 to 2.95 billion respectively over the period from 1990 - 2015. (9)
Similarly from their data spreadsheet, the minimum threshold for entering the middle 40% (50-90th percentile of global annual income) grew from $2097 to $5566 (in 2011 dollars) from 1990 to 2015 if I’m interpreting correctly. (10)
Also worth noting this study considers fossil fuel consumption emissions only. Entirely fair given data limitations, but the 24.5% of global emissions from agriculture, land use, waste, and cement are probably more equitably distributed. (11)
To conclude, is it correct that the world’s richest (keeping in mind that you only need an income of $38000 USD per year to make the top 10%) are the most responsible for emissions? Absolutely. We knew that. (12)
But this report doesn’t really provide new proof of that so much as it conducts a thought experiment based on a hard relationship between income and emissions.

Press release and links to PDF report can be found here:

oxfam.org/en/press-relea…

(END)

• • •

Missing some Tweet in this thread? You can try to force a refresh
 

Keep Current with Seaver Wang

Seaver Wang Profile picture

Stay in touch and get notified when new unrolls are available from this author!

Read all threads

This Thread may be Removed Anytime!

PDF

Twitter may remove this content at anytime! Save it as PDF for later use!

Try unrolling a thread yourself!

how to unroll video
  1. Follow @ThreadReaderApp to mention us!

  2. From a Twitter thread mention us with a keyword "unroll"
@threadreaderapp unroll

Practice here first or read more on our help page!

More from @wang_seaver

Apr 1
In a new piece, I emphasize how the ability to build new upstream metallurgical and chemical plants is crucial to industrial competitiveness and the downstream ability to mass produce drones, batteries, or electric cars.

In other words, what if it’s all the aluminum tech stack? Image
“Raw materials importantly determine the performance or form factor of the final product—the size or thinness of the silicon wafer, the capacity and longevity of the battery, and the strength of a permanent magnet motor.”

breakthroughjournal.org/p/the-aluminum…
The “aluminum tech stack” is a provocation to be sure, not a verbatim thesis. Yet the connections it highlights are remarkable:

- A country producing 15 million tons of aluminum (China in 2010) is coincidently producing 6-7 million tons/yr of carbon based anodes whose production route is similar to synthetic battery graphite.
- I actually forgot to add the statistic that 25% of Chinese aluminum consumption goes to transportation sector applications.
- Common aluminum alloys require silicon metal, which is also a key feedstock for solar and chips. In fact, a number of metallurgical silicon smelters in China are co-located with aluminum smelters.
- Alumina refineries upstream of aluminum smelting recover gallium, a key semiconductor material, as a byproduct. Circa 2012 the world’s largest producer of gallium was the Aluminum Corporation of China.
- Aluminum smelting expertise is highly inter-transferable with rare earth metal refining, a similar electrolytic process.
- Planners and engineers adding 1-2 million tons of aluminum capacity yearly across China can similarly accommodate other electricity-intensive heavy industries.
- Lithium-ion batteries use aluminum foils as the current collectors at the cathode end.Image
Read 14 tweets
Feb 9
Let’s be clear how much the frame on the aluminum “long green march” story in China has now shifted, from “renewables are cheaper than coal so China is now moving heavy industry to where renewables are!” to “I built a plant here to use cheap coal mined 8 miles down the road, and now the govt is making me buy renewables certificates for 30% of my power needs”

As I do think it’s useful for the climate folks and what I’ll call the "China futurist" folks in this convo to understand what these plants in Xinjiang + Inner Mongolia look like, I’m going to show each of them here while I lay out some thoughts. 🧵

Tianshan Aluminum, Xinjiang 44°25'N 86°04'EImage
Why is this important? I don’t think there’s any question solar/wind will supply much of our future energy. The risk is this:
Hallucinating that solar/wind are *already* cheaper than fossils for directly supplying heavy industry will skew policy + advocacy over the next 5 yrs, lead to inevitable disappointment, and end up further entrenching Chinese dominance of strategic manufacturing.

Xinjiang Jiarun 44°18'N 86°25'EImage
After all, low Chinese solar/wind/battery project costs are likely at the extreme end of what Europeans, Japan, or CAN/AUS/US could hope to bring about 5 yrs from now. If not even the Chinese are jumping to build fully green-powered industrial complexes now, how can leapfrogging towards a solar/wind electrostate vision for say Europe be the key to reasserting industrial competitiveness?

Xinfa Wujiaqu 44°16’N 87°42'EImage
Read 18 tweets
Sep 18, 2025
Amused that Alexander Zaitchik @newrepublic attacks @billmckibben’s citation of my paper on clean tech minerals in critiquing McKibben’s “ecomodernist optimism” on green growth, yet doesn’t point to anything specifically wrong with my research.

Spoiler: I’m right.🧵 Image
I think this is an example of the shallowness of some pushback against ecomodernism. Despite revering "scientific" refutations of growth, critics often don’t actually read underlying research, let alone offer specific critiques of research they dislike.

newrepublic.com/article/199748…
Zaitchik’s core critique of my work is:
- I find global mineral reserves suffice for decarbonizing the power generation sector to 2050 for nearly all minerals in 75 scenarios.
- but another Cornell/UMichigan study finds copper can’t “be mined fast enough” to electrify the US.
Read 17 tweets
May 7, 2025
Ketan mocks inertia chatter re: Spain outage while misunderstanding inertia. Inertia doesn’t scale with generation output but rather with spinning generator mass. Spain had 4 reactors online, 2 at 70% power. Inertia equivalent to 4 reactors at full power!

More thoughts below.🧵 Image
In his blog post + thread, Ketan shares ~10 graphs of Spanish grid data to show how in April 2025 Spain’s nuclear fleet was generating at historic record lows. Except it’s largely misleading as nuclear generation is a poor proxy for the % of grid-forming resources on the grid. Image
Inertia scales w kinetic energy of spinning generators, which are synced to grid at fixed rpm even if output to the grid is reduced.

Spain: 2/4 nuclear units at 70% power but inertia equiv to 4 units at full power. This is in line with other past spring/fall shoulder seasons. Image
Read 31 tweets
Mar 11, 2025
21 House Republicans just wrote a letter urging continued IRA energy credits. Most have solar/wind projects or clean tech factories in district, or are in swing districts. THREAD🧵

Arizona 6th - Juan Ciscomani - Many solar projects. Battery factories in Tucson. Swing district. Image
California 20th - Vince Fong - Bakersfield area, R+16 district but lots of solar and amazing solar resource potential especially to the southeast near Edwards Air Force Base, some good wind resource in the Tehachapi Mountains. Image
California 22nd - David G. Valadao - Bakersfield area neighboring the 20th district, lots of solar developments in the larger I-5 highway corridor. Competitive district. Image
Read 22 tweets
Apr 25, 2024
To supply low-carbon power to a grid via nuclear, solar, wind, or grid batteries, how much material must we dig up to build those power plants?
Answer: far less than for fossil fuels, with nuclear needing the least mining. New @TheBTI report by my team:
thebreakthrough.org/issues/energy/…
Image
Big takeaways:
Coal? Digs ~1.18 million kgs of rock+coal per GWh for fuel only
Solar+wind have improved much in last 10 yrs
Nuclear still needs least mining + critical minerals per GWh
Cu, steel, Ni, Li, U, Ag offer ways to improve mining footprint further
thebreakthrough.org/issues/energy/…
What inspired this analysis? Energy transition mining remains divisive, but discussions often cite flawed or out-of-date data, or end up handwavy. For this analysis, we wanted to make an up-to-date comparison, w transparent methodology using public sources
apps.openei.org/REMPD/
Read 24 tweets

Did Thread Reader help you today?

Support us! We are indie developers!


This site is made by just two indie developers on a laptop doing marketing, support and development! Read more about the story.

Become a Premium Member ($3/month or $30/year) and get exclusive features!

Become Premium

Don't want to be a Premium member but still want to support us?

Make a small donation by buying us coffee ($5) or help with server cost ($10)

Donate via Paypal

Or Donate anonymously using crypto!

Ethereum

0xfe58350B80634f60Fa6Dc149a72b4DFbc17D341E copy

Bitcoin

3ATGMxNzCUFzxpMCHL5sWSt4DVtS8UqXpi copy

Thank you for your support!

Follow Us!

:(