
September 24, 2020 - Canada/Ontario/Québec daily update
Current data as of 2 am.
Data is 100% public and official, and fully cited.
Current data as of 2 am.
Data is 100% public and official, and fully cited.


9 newly reported deaths in all of Canada (population: 37,971,020).
Total deaths: 9,243 (2.4 deaths per every 10,000 people in Canada or 0.02%).
Total deaths: 9,243 (2.4 deaths per every 10,000 people in Canada or 0.02%).

Canada - Covid-19 still presents a risk primarily to the elderly, not to children and hardly to working-age adults.
(n.b. Based on 2020 YTD data for Covid-19 - figures to be revised upward as needed.)
(n.b. Based on 2020 YTD data for Covid-19 - figures to be revised upward as needed.)

Deaths among those over 80 account for 71.3% of covid deaths.
This contrasts to overall deaths, for which the 80+ cohort accounts for 50.9% of deaths (based on 2016-2018 averages).
(n.b. Based on 2020 YTD data for Covid-19 - figures to be revised upward as needed.)
This contrasts to overall deaths, for which the 80+ cohort accounts for 50.9% of deaths (based on 2016-2018 averages).
(n.b. Based on 2020 YTD data for Covid-19 - figures to be revised upward as needed.)

Bear in mind that the risk of death will always rise in line with one's advancing age.
In a given year, like 2018 as an example, 9.2% of those in the over-80 age cohort pass away.
(n.b. Based on 2020 YTD data for Covid-19 - figures to be revised upward as needed.)
In a given year, like 2018 as an example, 9.2% of those in the over-80 age cohort pass away.
(n.b. Based on 2020 YTD data for Covid-19 - figures to be revised upward as needed.)

Children and young adults are at lower risk from Covid-19 than from influenza and pneumonia.
The risk of death by Covid-19 is higher than that by influenza and pneumonia as one's age advances.
(n.b. Based on 2020 YTD data for Covid-19 - figures to be revised upward as needed.)
The risk of death by Covid-19 is higher than that by influenza and pneumonia as one's age advances.
(n.b. Based on 2020 YTD data for Covid-19 - figures to be revised upward as needed.)
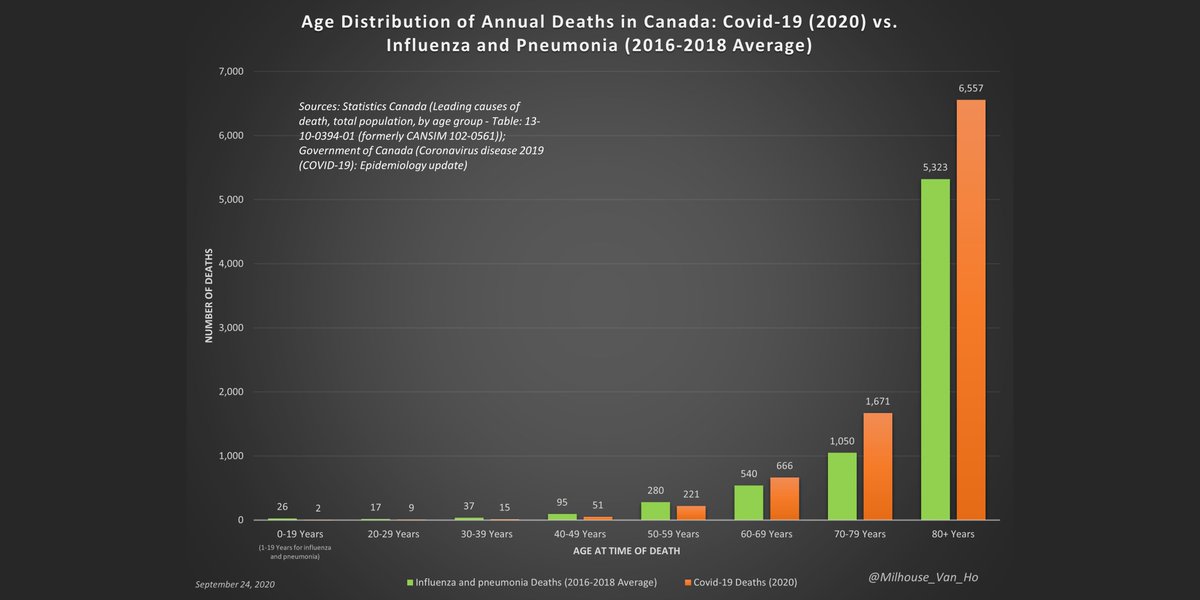
If considered as a wholly distinct and separate cause of death in Canada, Covid-19 may be the 6th leading cause of death in 2020, much like influenza and pneumonia.
(n.b. Based on 2020 YTD data for Covid-19 - figures to be revised upward as needed.)
(n.b. Based on 2020 YTD data for Covid-19 - figures to be revised upward as needed.)

However, Covid-19 is often not a wholly distinct and separate cause of death as there are other medical conditions involved in many cases.
There are also cases in which it is not even a cause of death, but the individual had tested positive sometime prior to their death.
There are also cases in which it is not even a cause of death, but the individual had tested positive sometime prior to their death.

This is what 2020 might look like in Ontario if:
1. All-cause deaths (excl. Covid-19) are in line with 2014-18 averages
2. All Covid-19 deaths are single-cause excess deaths
(n.b. Based on 2020 YTD data for Covid-19 - figures to be revised upward as needed.)
1. All-cause deaths (excl. Covid-19) are in line with 2014-18 averages
2. All Covid-19 deaths are single-cause excess deaths
(n.b. Based on 2020 YTD data for Covid-19 - figures to be revised upward as needed.)

This is what 2020 might look like in Ontario month-to-month if:
1. All-cause deaths (excl. Covid-19) are in line with 2016-18 averages
2. All Covid-19 deaths are single-cause excess deaths
(n.b. Based on 2020 YTD data for Covid-19 - figures to be revised upward as needed.)
1. All-cause deaths (excl. Covid-19) are in line with 2016-18 averages
2. All Covid-19 deaths are single-cause excess deaths
(n.b. Based on 2020 YTD data for Covid-19 - figures to be revised upward as needed.)

Ontario (population: 14,745,040):
Total deaths: 2,835 (1.9 deaths per every 10,000 people in ON or 0.02%).
Total deaths: 2,835 (1.9 deaths per every 10,000 people in ON or 0.02%).

Ontario now reports:
- 24 in ICU
- 9 in ICU on a ventilator
- 24 in ICU
- 9 in ICU on a ventilator

Ontario now reports:
- 88 in hospital
- 24 in ICU
- 9 in ICU on a ventilator
- 88 in hospital
- 24 in ICU
- 9 in ICU on a ventilator
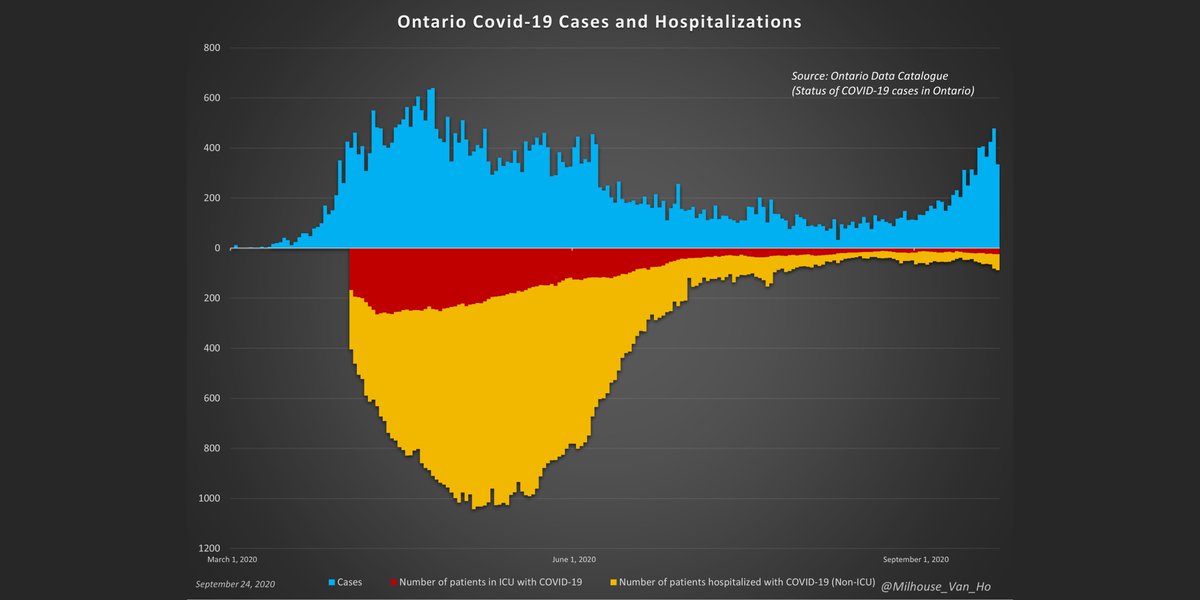
A note on hospitalization data: This may include those who have had a positive test result after being hospitalized for a different reason.

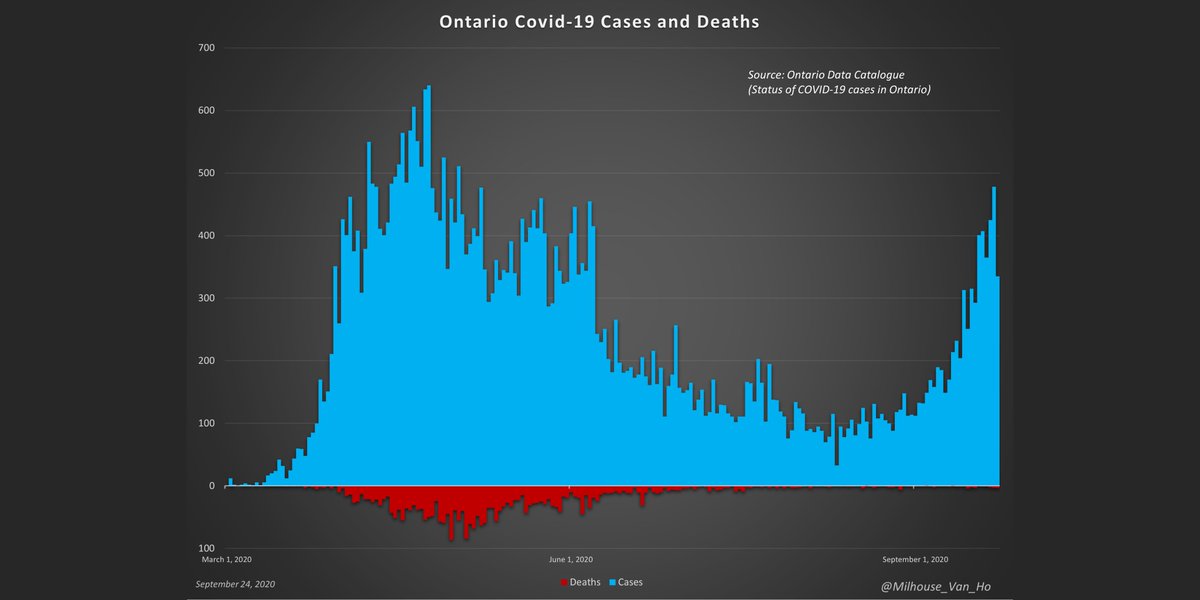
Ontario - The proportion of cases (positive test results) resulting in death (yellow line) has fallen from ~15% at peak.

This is what 2020 YTD might look like in Ontario on a cumulative basis, using 2016-18 average monthly deaths as a proxy for 2020 data.

Ontario - Growth in cumulative cases (positive test results) is outpacing growth in cumulative deaths in September.
This month so far:
- Cumulative cases up 13.7%
- Cumulative deaths up 0.9%
This month so far:
- Cumulative cases up 13.7%
- Cumulative deaths up 0.9%

Ontario - Growth in cumulative tests conducted is outpacing growth in cumulative cases (positive test results) in September.
This month so far:
- 119 tests conducted per 1 positive test (0.8%)
- Cumulative tests up 23.0%
- Cumulative cases up 13.7%
This month so far:
- 119 tests conducted per 1 positive test (0.8%)
- Cumulative tests up 23.0%
- Cumulative cases up 13.7%
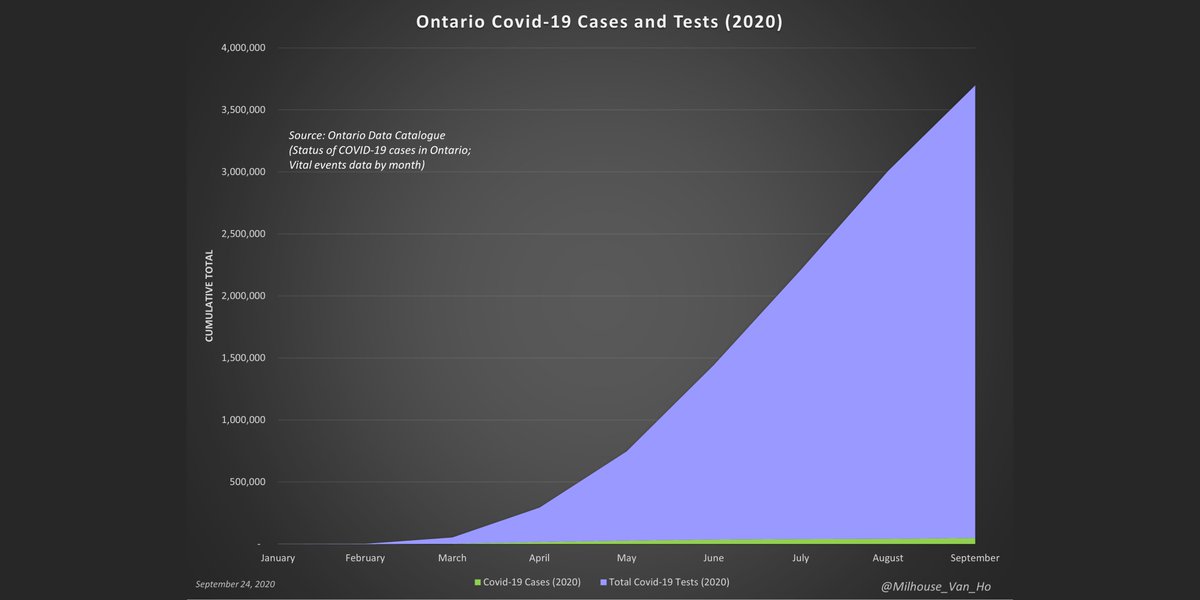
The Ontario government's ramping up of testing and easing of testing criteria have likely affected the number of cases (positive test results).
Positive test results will probably rise further as the government works toward its goals of 50,000 and then 78,000 daily tests.
Positive test results will probably rise further as the government works toward its goals of 50,000 and then 78,000 daily tests.

The positivity rate on tests conducted in Ontario (yellow line) has fallen markedly from the spring peak.

This chart normalizes cases (positive test results) to show how many would have been reported since March 1, 2020 if:
- the current level of testing (daily average over past 7 days) had been maintained throughout, and
- no changes to reported positivity rates.
- the current level of testing (daily average over past 7 days) had been maintained throughout, and
- no changes to reported positivity rates.

City of Toronto (population: 2,731,571 or 19% of Ontario):
Total deaths: 1,178 (4.3 deaths per every 10,000 people in Toronto or 0.04%)
41.6% of Ontario deaths
3 deaths since August 1, 2020
Total deaths: 1,178 (4.3 deaths per every 10,000 people in Toronto or 0.04%)
41.6% of Ontario deaths
3 deaths since August 1, 2020

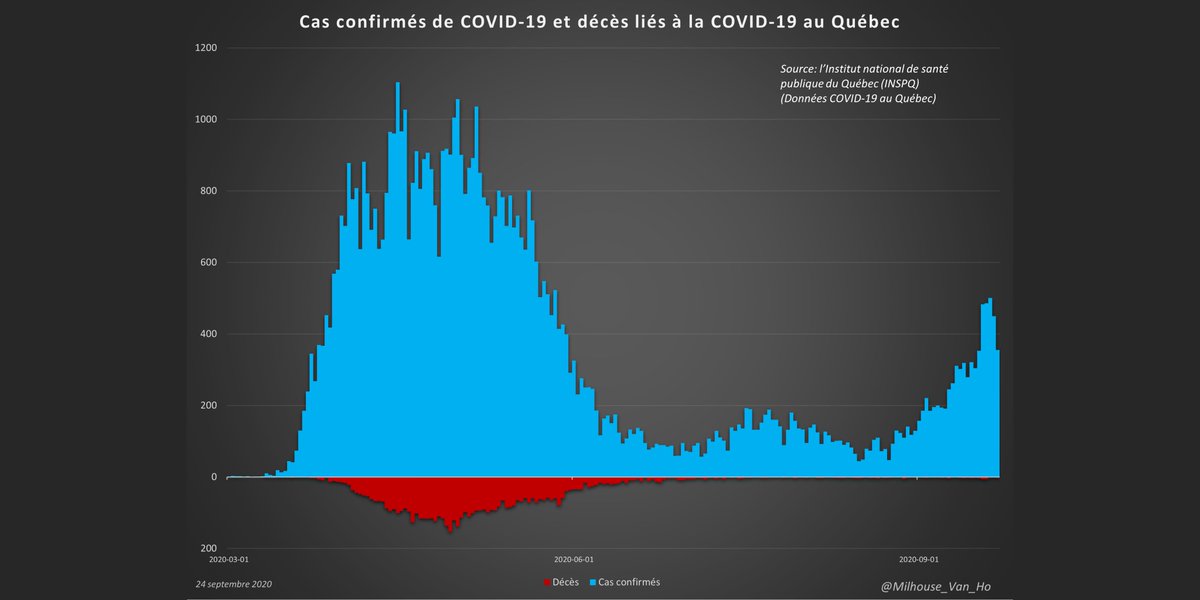
Québec (population: 8,552,362):
Total deaths: 5,809 (6.8 deaths per every 10,000 people in QC or 0.07%).
(Note that Québec backdates newly reported deaths.)
Total deaths: 5,809 (6.8 deaths per every 10,000 people in QC or 0.07%).
(Note that Québec backdates newly reported deaths.)
Québec now reports:
- 30 in ICU (aux soins intensifs)
- 30 in ICU (aux soins intensifs)

Québec now reports:
- 178 in hospital
- 30 in ICU (aux soins intensifs)
- 178 in hospital
- 30 in ICU (aux soins intensifs)

Québec - The proportion of cases (positive test results) resulting in death (yellow line) has fallen from ~15% at peak.

The Québec government's ramping up of testing has likely affected the number of cases (positive test results).

The positivity rate on tests conducted in Québec (yellow line) has fallen markedly from the spring peak.

• • •
Missing some Tweet in this thread? You can try to
force a refresh


