I suspected that today’s ONS life expectancy release would not be met with the usual fanfare, but I guess I hadn’t anticipated complete media radio silence.
Still, it’s not the most “pandemic appropriate” news. UK life expectancy is at a new high!
What’s the story? 1/7
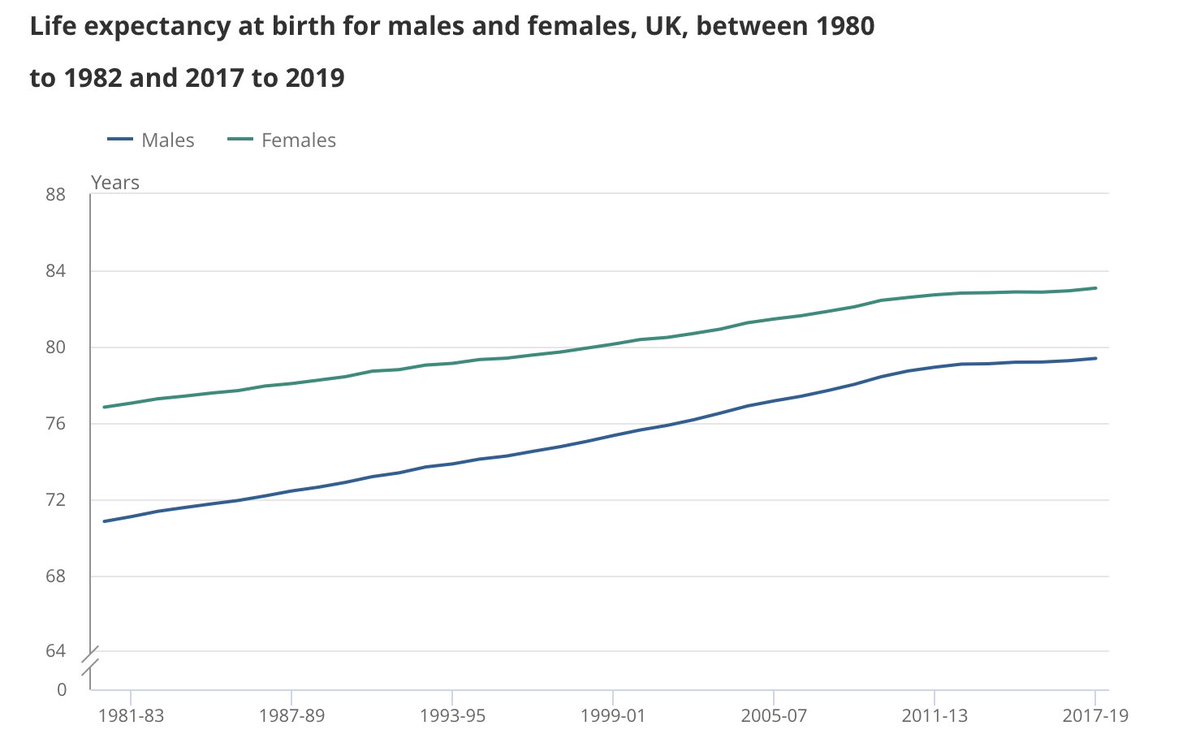
UK life expectancy at birth is up by six weeks for males and seven weeks for females. Here’s the numbers direct from Ed at the ONS 👇
Crucially though, this is just updating National Life Tables to include 2019, which had record low death rates. 2/7
Life expectancy at age 65 has also increased, by around 6 weeks each for males and females.
Life expectancy at 65 is now: 83.8 years for males 86.1 years for females
Note that life expectancy at 65 is 3-4 years higher than life expectancy at birth. 3/7
No account is taken in these particular measures of life expectancy of observed death rates in 2020, or expert views on what death rates will look like in 2021 and beyond. It’s a mathematical calculation based on death rates in the three-year period 2017 to 2019. 4/7
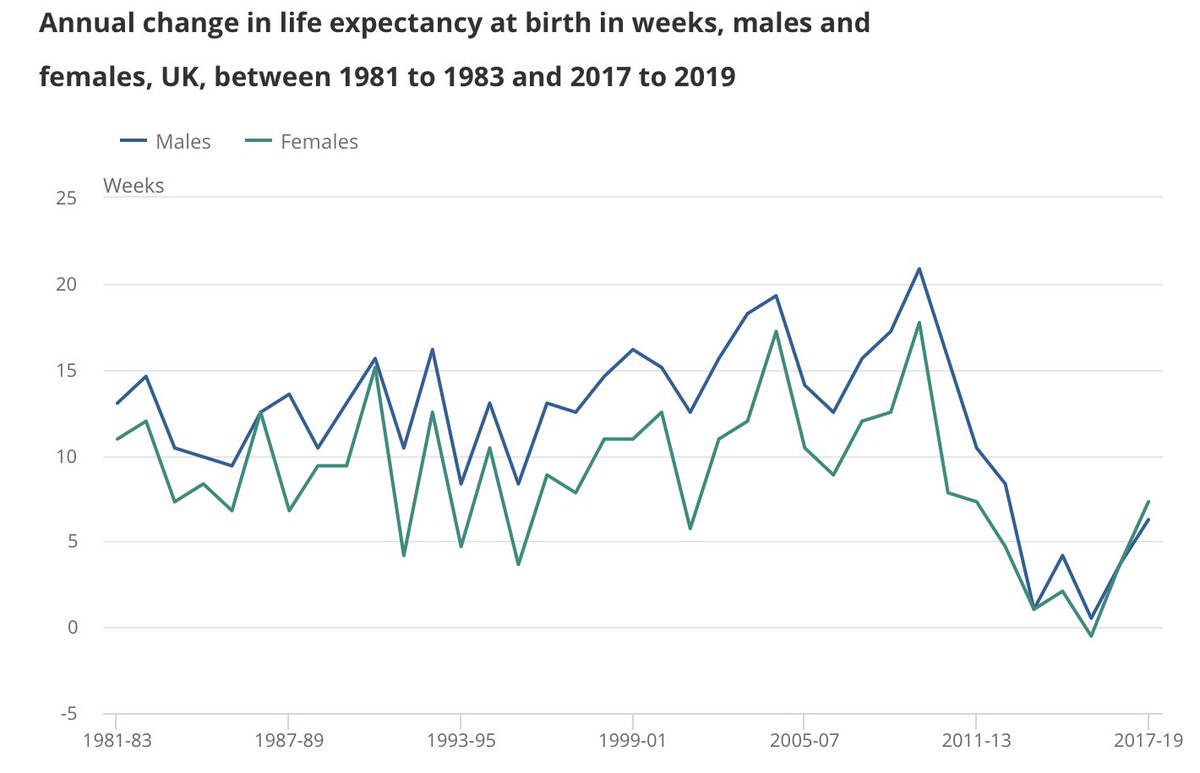
Life expectancy on this measure continues to increase, as it has for decades and is expected to do in the long term.
The rate of increase has been much slower in the last decade though, as shown below. 5/7
The next few years will be highly unusual as the impact of the pandemic works through the data. Exceptionally high death rates in 2020 (and 2021?) will visibility distort life expectancy in the years ahead, as similar pandemics have done. 6/7
There‘s another measure (“cohort life expectancy”) which incorporates views on future changes to death rates. ONS do a projection every 2 years (and CMI do a separate one annually). Incorporating short and long term impacts of COVID into these will be especially challenging! 7/7
• • •
Missing some Tweet in this thread? You can try to
force a refresh
I've reproduced and updated this beautiful chart from @OurWorldInData showing life expectancy in England and Wales at different ages, since 1841.
The data largely speaks for itself but I'll make a few brief observations. 🧵
Most of the life expectancy gain is due to large reductions in infant and child mortality rates.
Progress reducing mortality has been made at all ages, but it's the youngest ages where most progress has been made. There's no longer a big difference between LE at birth vs age 10.
The data source in the chart upthread is the total population of England and Wales, which includes military deaths. So the first downward spike results from deaths during WW1 as well as the Spanish Flu. WW2 deaths are also very visible during the 1940s.
I've drawn some heat from anti-vaxx accounts recently. Some just spit obvious lies and hatred, and are quickly blocked. Perhaps more dangerous though are the ones who share bogus data and analysis, that some might not immediately be able to see though. Let's talk about "Ben".
My re-examination of the BMJ Public Health data showed that countries with higher vaccination rates had lower excess deaths, and vice versa. This doesn't prove cause and effect but it's an obvious issue that the authors failed to address.
"Ben" responded to my post with a link to a chart from his own self-published "study" which he claims shows no such relationship in counties of Montana.
So what might be the differences between the countries shown in my analysis and the counties shown in his?
I’m late to this but I wanted to set out some thoughts on the awful @BMJPublicHealth excess deaths article.
Commentary has focussed on media coverage, linking deaths to vaccines, but I want to discuss the article itself, which should not have been published in its current form.
That is not to let @Telegraph @NewYorkPost and others who misreported this off the hook entirely. Reckless reporting has done considerable harm, going well beyond what was claimed in the paper.
More lives will be lost as misinformation fuels vaccine hesitancy.
But as I said below, when @bmj_company distanced itself from media misreporting, this was always going to happen. It's all very well to say the 'study' doesn't establish a link between excess deaths and vaccines, but it's full of inappropriate insinuation.
The first question to ask about excess deaths (or excess anything!) is 'excess over what?'
The new method gives the excess over mortality expected at the start of the year. So expectations for 2024 reflect the fact that we've seen higher mortality rates since the pandemic. 3/17
Our new commentary published in @LancetRH_Europe discusses the ongoing excess deaths in the UK, and for the first time provides granular analysis by age, place and cause.
Excess deaths arise directly and indirectly from the Covid pandemic. This includes:
- increased pressure on NHS urgent care services, resulting in poorer patient outcomes
- direct effects of Covid-19 infection
- disruption to chronic disease prevention, detection and management.
Newly published data from @OHID shows that, from June 2022 to June 2023, excess deaths were highest for ages 50-64, at 15% above normal.
In comparison, excess deaths were 11% higher than expected for under 25s and 25-49s, and were 9% higher for over 65s.