stuart mcdonald Profile picture
MBE. Partner @LCP_Actuaries. Founder / cochair @COVID19actuary. CMI ExCo. “God-level nerd”. “Superstar actuary”. Own views.
@littlegravitas@c.im 🇺🇦 🇪🇺 🇮🇱 🇵🇸 #FBPE Profile picture 2 subscribed
Feb 25 17 tweets 4 min read
There’s a lot of confusion about the new ONS excess deaths methodology. Some thoughts on the model, its limitations and #ExcessDeaths in general.

These are personal views. I don’t speak for ONS or any other organisations or individuals involved in updating the method. 1/17 Firstly, neither the new method nor the 5-year average it replaces, were designed for measuring the impact of a multi-year pandemic on mortality.

I’ve said this before but it bears repeating. 2/17
Dec 4, 2023 9 tweets 3 min read
Our new commentary published in @LancetRH_Europe discusses the ongoing excess deaths in the UK, and for the first time provides granular analysis by age, place and cause.

Excess deaths now highest for middle-aged adults, driven by cardiovascular causes.
thelancet.com/journals/lanep… Excess deaths arise directly and indirectly from the Covid pandemic. This includes:
- increased pressure on NHS urgent care services, resulting in poorer patient outcomes
- direct effects of Covid-19 infection
- disruption to chronic disease prevention, detection and management.
Oct 6, 2023 8 tweets 3 min read
This week the CMI released an international comparison of excess mortality during the coronavirus pandemic (using data up to end 2022).

England & Wales (E&W) had the 3rd highest excess mortality of Western European and Nordic comparators, since the start of the pandemic. Image Austria and Italy are the only Western European and Nordic countries analysed with higher excess mortality than E&W since the start of the pandemic.

The Western European and Nordic countries analysed with the lowest excess mortality are Norway and Sweden. Image
Oct 4, 2023 20 tweets 6 min read
On @BBCMoreOrLess this morning I was delighted to have the opportunity to debunk the most ludicrous claim I’ve yet been asked to address!

John Campbell shared a video with his 2.9 million followers with claims of over 150,000 excess deaths compared to if no-one was vaccinated. In the video John repeated and endorsed incorrect claims made in an anonymous blog by “the nobody who knows everybody” that there have been over 150,000 excess deaths as a result of people getting vaccinated.

Here is how and why we can be certain this is completely false. 🧵 Image
Sep 6, 2023 12 tweets 5 min read
Another day, another viral post sharing vaccine misinformation.

Has @tniwef really discovered “proof of a mRNA Disaster!”

Unsurprisingly, that’s a firm “No!”

Can you see what they did wrong? 🧵 Image Let’s zoom in on that graph.

It shows that the % of all cause deaths from vaccinated people aged 18plus is:
1. Higher than the % of all cause deaths from unvaccinated people
2. Higher than the % of people aged 18 plus who have been vaccinated.

Should this concern us? No! 2/n Image
Apr 13, 2023 5 tweets 2 min read
ONS deaths data has been released for week ending 31 Mar.

2,004 more deaths were recorded in-week compared to 5-year avg. That’s 21% more, a large excess but partly due to Easter distorting 5yr avg.

Year-to-date there have been 171,600 deaths recorded, 8% above the 5-year avg. Image 
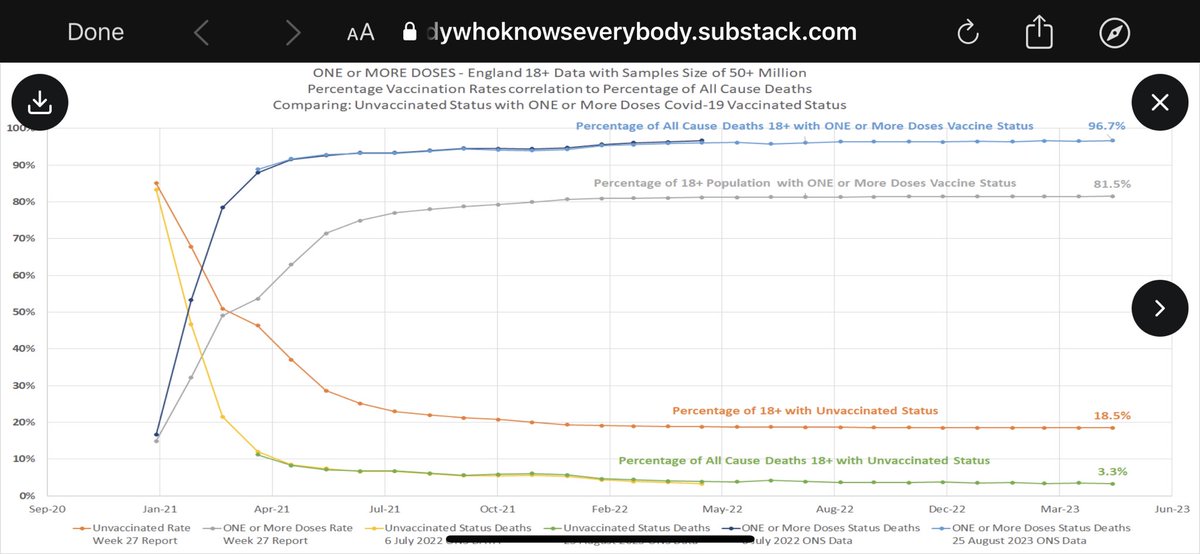
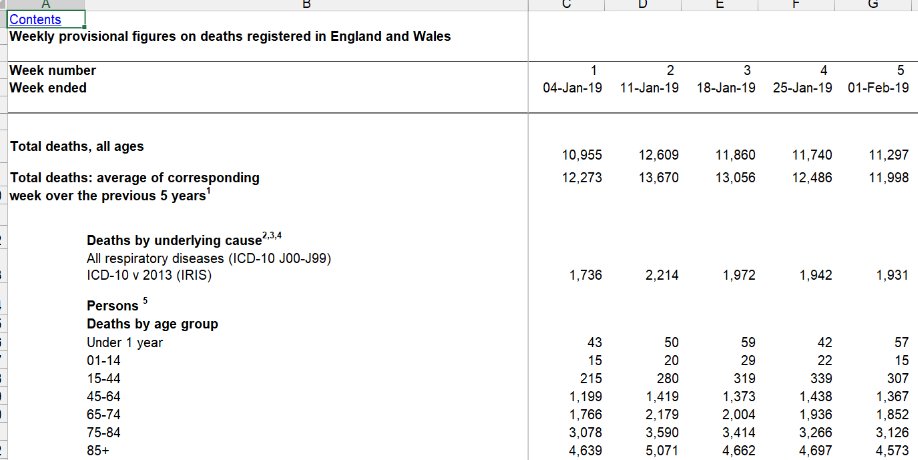
There were 634 deaths registered in England and Wales this week where COVID was mentioned on the death certificate. That’s higher than last week (624).

68% of deaths with COVID mentioned on the death certificate had it listed as underlying cause.
Feb 20, 2023 4 tweets 2 min read
An important new report from my @LCP_Actuaries colleagues shows that most of the increase in the number of economically inactive people during the pandemic can be explained by long term sickness.

This runs counter to the “great retirement” narrative. In fact the number of working age retirees is lower now than before the pandemic.
Feb 14, 2023 5 tweets 2 min read
ONS deaths data has been released for week ending 3 Feb.

186 more deaths were recorded in-week compared to the 5-year average. That’s 1% more, i.e. death counts similar to the average.

Year-to-date there have been 75,717 deaths recorded, 10% more than the 5-year average. Image There were 499 deaths registered in England and Wales this week where COVID was mentioned on the death certificate. That’s the lowest so far this year.

67% of deaths with COVID mentioned on the death certificate had it listed as underlying cause.
Jan 24, 2023 5 tweets 2 min read
ONS deaths data has been released for week ending 13 Jan. 2,837 more deaths were recorded in-week compared to the 5-year average. That’s 20% more - another significant excess.

Year-to-date there have been 32,364 deaths recorded, 17% more than the 5-year average. There were 922 deaths in England and Wales this week where COVID was mentioned on the death certificate. That’s the we’ve seen in one week since last April.

71% of deaths with COVID mentioned on the death certificate had it listed as underlying cause.
Jan 5, 2023 9 tweets 3 min read
ONS deaths data has been released for week ending 23 Dec.

2,982 more deaths were recorded in-week compared to the 2015-19 average. That’s 26% more, the largest excess we’ve seen all year.

Year-to-date there have been 567,379 deaths recorded which is 8% more than 2015-19 avg. There were 429 deaths in England and Wales this week where COVID was mentioned on the death certificate. The number of COVID deaths increased each week through December.

72% of deaths with COVID mentioned on the death certificate had it listed as underlying cause.
Sep 8, 2022 9 tweets 4 min read
I had an extensive and at times provocative discussion with @freddiesayers on the significant excess deaths we’ve seen in recent months.

We discussed what the data shows and the limits of what we can currently say about who is dying and the immediate and underlying causes. Data from @OHID shows a clear pattern of recent excess mortality in all adult age groups. Cardiovascular, diabetes and urinary diseases stand out as major causes with a significant excess, where acute covid does not seem to be the immediate cause.
Sep 6, 2022 5 tweets 2 min read
ONS deaths data has been released for week ending 26 August.

1,785 more deaths were recorded in-week compared to the 2015-19 average. That’s 19% more.

Year-to-date there have been 374,970 deaths recorded which is 6% more than the 2015-19 average. Image There were 453 deaths in England and Wales this week where COVID was mentioned on the death certificate. That is a significant fall from last week.

62% of deaths with COVID mentioned on the death certificate had it listed as underlying cause.
Aug 29, 2022 10 tweets 4 min read
Are we seeing significant excess deaths in England and Wales at the moment? Yes, absolutely. Death rates have been around 11% above pre-pandemic over the last 8 weeks.

So why might skeptics suggest otherwise? If acting in good faith then they don’t fully understand the data 🧵 There has been a lot of discussion of excess deaths in the last week or so. The issue made the front page of the @Telegraph in an article which (I’d say wrongly) pinned the blame on lockdowns. /2
Aug 19, 2022 15 tweets 6 min read
This rhetoric is divisive and unhelpful, particularly the headline.

It’s correct to say we are experiencing significant excess deaths. It’s also correct that much of the excess didn’t arise directly from COVID.

But I disagree with calling these deaths “lockdown effects”. 🧵 We have been experiencing significant excess deaths for around three months now, as I have highlighted each week.

Some of the excess is explained by the ageing population, but the CMI’s age-standardised calculation still shows significant excess deaths - over 11,000 this year.
Aug 16, 2022 6 tweets 2 min read
ONS deaths data has been released for week ending 5 August.

1,662 more deaths were recorded in-week compared to the 2015-19 average. That’s 18% more.

Year-to-date there have been 342,691 deaths recorded which is 5% more than the 2015-19 average. Image 
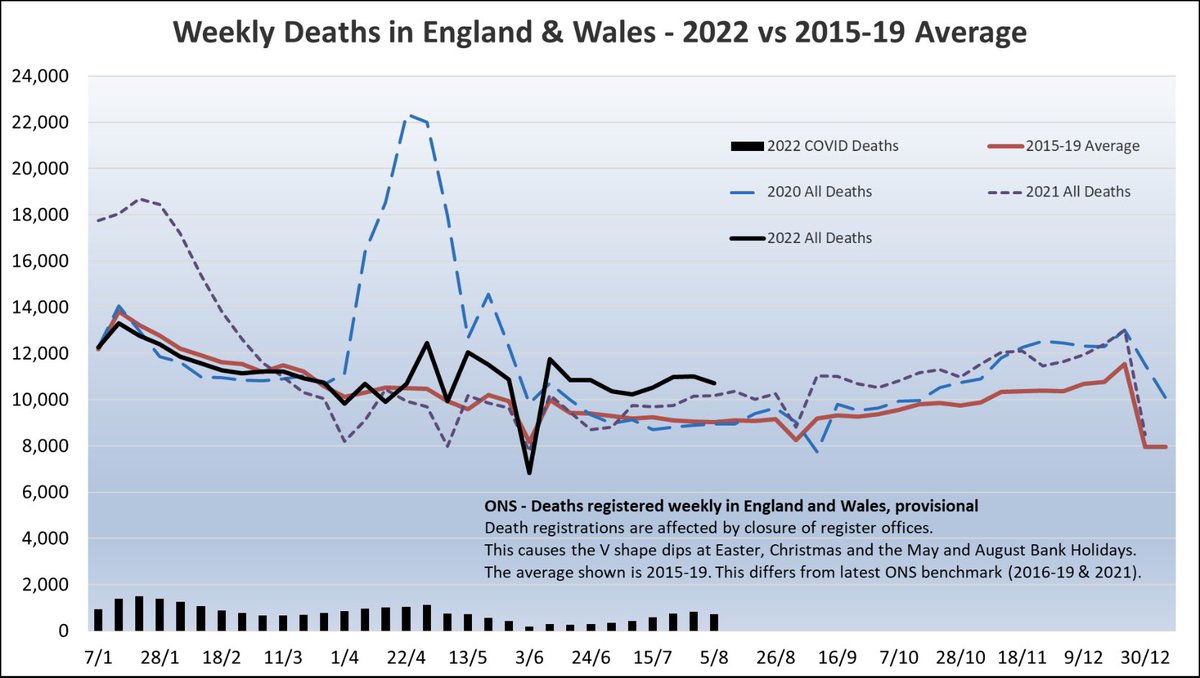
There were 723 deaths in England and Wales this week where COVID was mentioned on the death certificate. That is a significant fall from last week.

65% of deaths with COVID mentioned on the death certificate had it listed as underlying cause.
Jul 30, 2022 8 tweets 5 min read
A lot of people have asked for a @COVID19actuary view on this thread. I’ll give a personal reply for now, though others I’ve spoken to concur.

Big picture: broad agreement that the recent excess mortality is concerning and we need to better understand root causes. Detail below. My biggest quibble is around the size of the excess. Yes, @ONS shows 1,034 excess deaths a week in Eng&Wal over the last 11 weeks. However, after age-standardising, around half the excess goes away.

CMI analysis shows 486 excess deaths a week over the same period.
Jan 29, 2022 6 tweets 2 min read
This morning I had one of those difficult conversations that happens in these strange covid times. I ruined someone’s weekend when they were trying to help me out. I’m sure I did the right thing but it still doesn’t feel great. I couldn’t take my son to football this morning but one of the others dads said he’d help out.

I got a text saying hopefully on his way soon - just doing second LFT of the morning! Another text followed saying “all good - second LFT negative”.
Jan 24, 2022 7 tweets 4 min read
There are factual inaccuracies and misleading statements in this short thread - disappointing from a former Secretary of State @DavidDavisMP. Let’s quickly walkthrough them to set the record straight if possible. 1. Saying there have been “only” 17,371 COVID deaths with no other underlying causes is misleading. This has been repeatedly addressed, including this thread from earlier today. Most older people have one or more pre-existing conditions. It is wrong to exclude their deaths.
Dec 1, 2021 5 tweets 2 min read
Latest ONS deaths data (to week ending 19 November) has been released.

1,753 more deaths were recorded in-week compared to the 2015-19 year average. That’s 17% higher.

Year-to-date there have been 516,953 deaths recorded, which is 10% higher than the 2015-19 average. There are 952 deaths in England and Wales where COVID was mentioned on the death certificate this week, down from 1,020 last week.

86% of deaths with COVID mentioned on the death certificate had it listed as as underlying cause (818 out of 952 deaths this week with COVID).
Nov 21, 2021 14 tweets 6 min read
Ok, gather round, it’s time for todays statistics lesson. This week we are covering Simpson’s Paradox. I promise it won’t take long.

Simpson's Paradox when a relationship appears within individual groups of data but disappears or reverses when the groups are combined. Image A classical example of Simpson’s Paradox is currently doing the rounds on social media. I’m always loathe to share misinformation, but at this point it is probably fair to say that this chart is already very much “out there”, so here it is. Image
Sep 25, 2021 10 tweets 5 min read
The latest report from the Intensive Care National Audit and Research Centre (ICNARC) was released last night. It’s been a while since I’ve summarised one of these so I’ve picked out a few highlights, with help from @AdeleGroyer.

Full report here: icnarc.org/Our-Audit/Audi… 1/10 At the start of the current wave the proportion of hospital admissions who needed critical care was particularly high, but this is now falling, as is the total number of admissions.

By region, the North West and London have been especially badly hit by this latest wave. 2/10