
SEP 2020 CORONAVIRUS CASES INCREASES
IN UK, FRANCE, ITALY, SPAIN
APPEAR DIFFERENT FROM SPRING
The UK, along with other European countries, is experiencing a rise in SARS-CoV-2 cases.
[24 September 2020, v1.1]
[Analysis, opinions & errors my own.]
IN UK, FRANCE, ITALY, SPAIN
APPEAR DIFFERENT FROM SPRING
The UK, along with other European countries, is experiencing a rise in SARS-CoV-2 cases.
[24 September 2020, v1.1]
[Analysis, opinions & errors my own.]
Many think this to be a similar situation to that experienced in the spring. However, there are also reasons to suspect that this might not be the case.
Here, an analysis using testing, cases and deaths data:
Here, an analysis using testing, cases and deaths data:
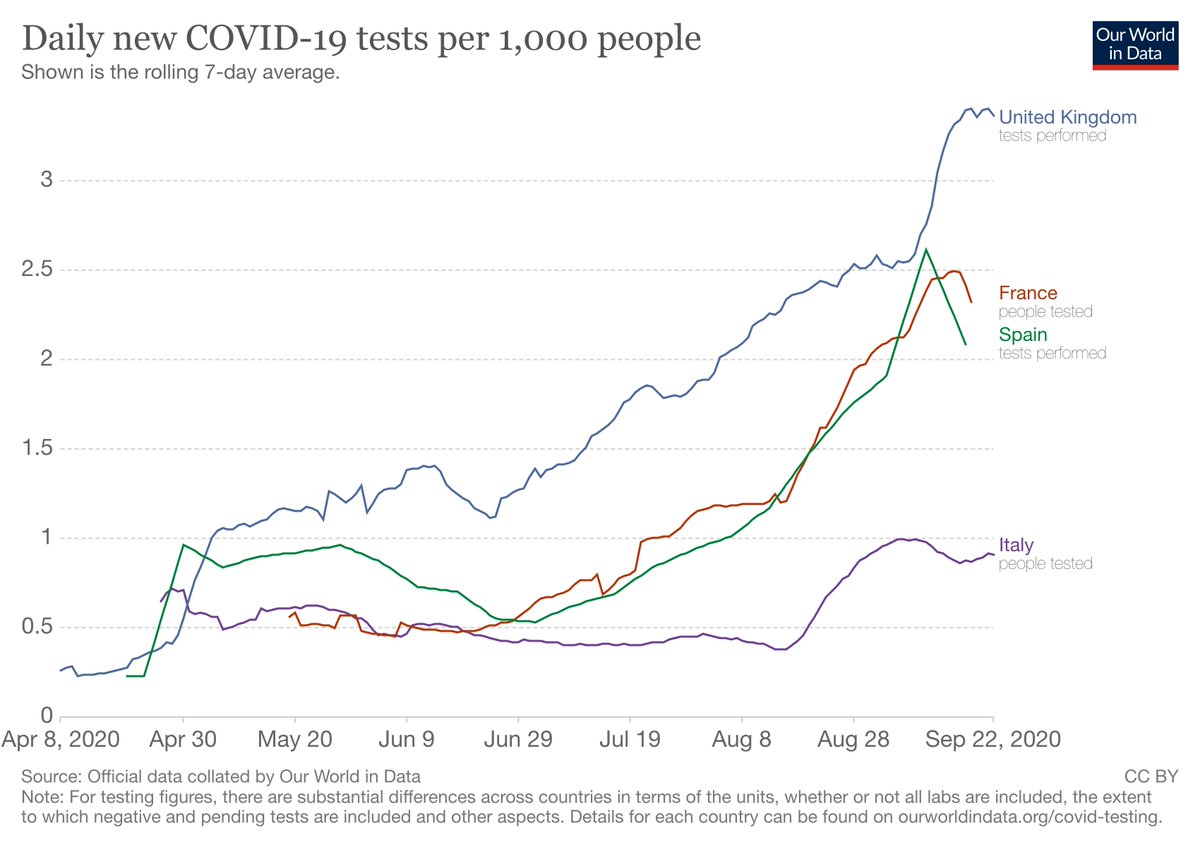
TESTING:
Testing has increased enormously. In spring mainly the ill were tested & the quantity of tests was far lower. In terms of true numbers of infections, we were only detecting the tip of the iceberg. Today, we conduct mass testing of the healthy.
Testing has increased enormously. In spring mainly the ill were tested & the quantity of tests was far lower. In terms of true numbers of infections, we were only detecting the tip of the iceberg. Today, we conduct mass testing of the healthy.
There are numerous issues with PCR testing: false positives etc... These likely tend to push cases upward & make the situation look more severe than it is.
However, in order to err on the side of caution, we will ignore these issues & assume that all test results are correct.
However, in order to err on the side of caution, we will ignore these issues & assume that all test results are correct.

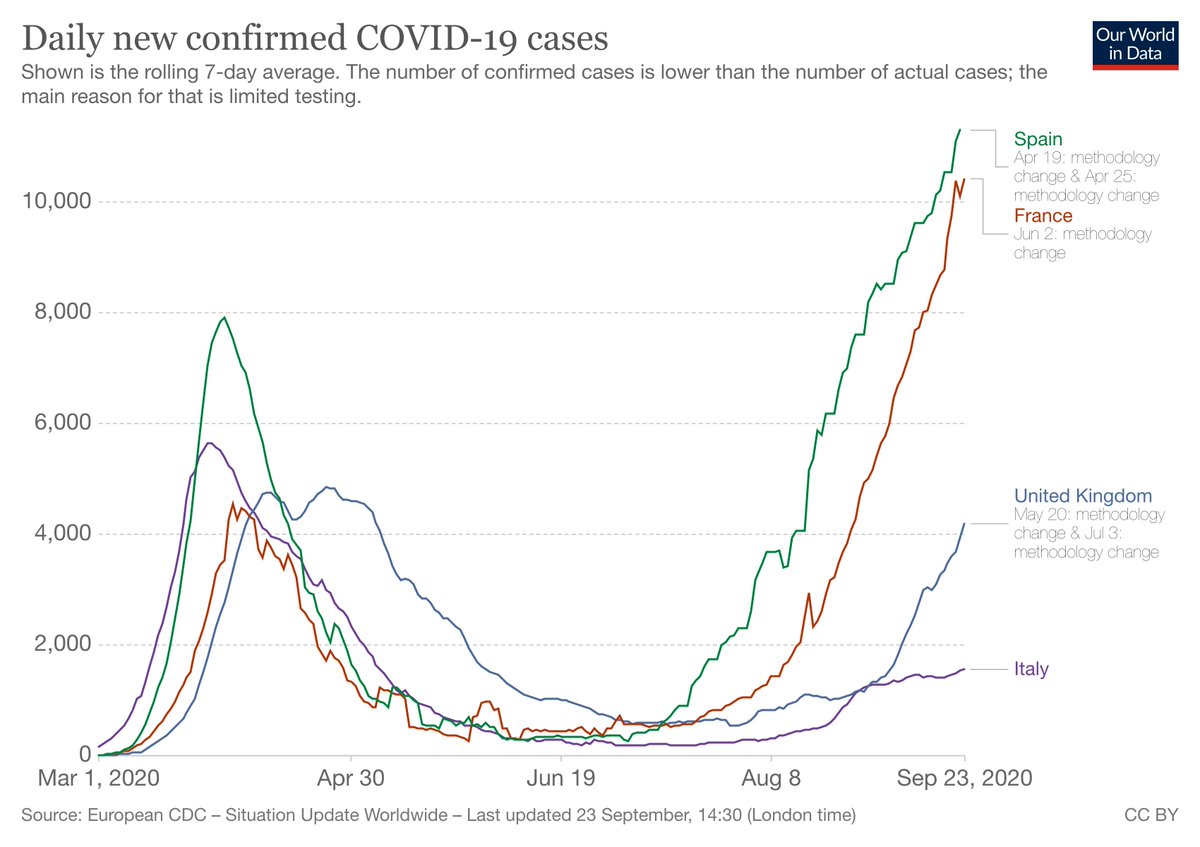
CASES:
Due to increased testing, one would expect that, if the underlying current situation was similar to that in spring, cases now would appear to rise at least as rapidly as they did then & would dwarf the spring in height (manyfold).
This is not the case.
Due to increased testing, one would expect that, if the underlying current situation was similar to that in spring, cases now would appear to rise at least as rapidly as they did then & would dwarf the spring in height (manyfold).
This is not the case.

The rise now is much shallower than in spring.
It is also nowhere near exponential.
Epidemic growth in a finite population can never be exponential but appears exponential-like in the early stages if most people are susceptible. This was visible in spring, but not currently.
It is also nowhere near exponential.
Epidemic growth in a finite population can never be exponential but appears exponential-like in the early stages if most people are susceptible. This was visible in spring, but not currently.

The log chart of cases shows more.
Ignore the 'height' of the curves, for the reasons mentioned above. It is the slope and character that are of interest.
Exponential growth on a log chart shows as linear (diagonal line); the steeper the slope, the faster the growth.
Ignore the 'height' of the curves, for the reasons mentioned above. It is the slope and character that are of interest.
Exponential growth on a log chart shows as linear (diagonal line); the steeper the slope, the faster the growth.

The log chart of cases shows:
a) No exponential growth (even in spring),
b) Recent growth is slower than in spring (shallower slope),
c) Recent growth shows signs of decelerating (Spain shows this most clearly with its inverted-saucer shaped curvature).
a) No exponential growth (even in spring),
b) Recent growth is slower than in spring (shallower slope),
c) Recent growth shows signs of decelerating (Spain shows this most clearly with its inverted-saucer shaped curvature).

DEATHS:
Viewed using deaths data, things are entirely different.
The recent increase in cases has not gone hand in hand with a large increase in deaths.
Deaths have risen far more slowly and are far lower than in spring; which is surely what matters most.
Viewed using deaths data, things are entirely different.
The recent increase in cases has not gone hand in hand with a large increase in deaths.
Deaths have risen far more slowly and are far lower than in spring; which is surely what matters most.

The log chart for deaths again allows us to look more closely at the character of the recent increase.
The current growth in deaths is different from that seen in spring (much shallower slope).
The current growth in deaths is different from that seen in spring (much shallower slope).

SUMMARY / CONCLUSIONS
Compared to the spring, the recent increases in cases & deaths are:
a) smaller (this we see most clearly from deaths),
b) slower (visible in both deaths and cases), far from exponential & showing signs of decelerating (see cases).
Compared to the spring, the recent increases in cases & deaths are:
a) smaller (this we see most clearly from deaths),
b) slower (visible in both deaths and cases), far from exponential & showing signs of decelerating (see cases).
The lower number of deaths is suggestive of a lower number of infections currently than in spring.
(Deaths, being far less dependent on testing, are a more robust indicator than cases of the relative number of actual infections.)
(Deaths, being far less dependent on testing, are a more robust indicator than cases of the relative number of actual infections.)
Assuming that the virus & environment are not greatly different from spring, a possible explanation for the smaller & slower increase in cases &, crucially, deaths might be that the virus is having a harder time finding & infecting a diminishing supply of susceptible people.
@threadreaderapp unroll
• • •
Missing some Tweet in this thread? You can try to
force a refresh


