I think it's fairly clear that our polling suggests that Biden's rebounded among northern white rural voters, whether in ME/MN/IA, but not at all in the South (not surprisingly):
Rural/exurban white voters:
TX: Trump 80, Biden 16
GA: Trump 82, Biden 14
IA: Trump 45, Biden 42
With Biden lagging a bit in PA compared to other Obama-Trump states in the polls, I think it's reasonable to theorize that the Appalachian white vote has been a bit more like the Southern rural white vote in this respect, or maybe even trended further Trump
This pattern has shown up in a number of recent primaries, including the GOP '16 primary. Trump swept the Southern/Appalachian white vote, including PA, while he struggled a bit in the more Midwestern/northern states
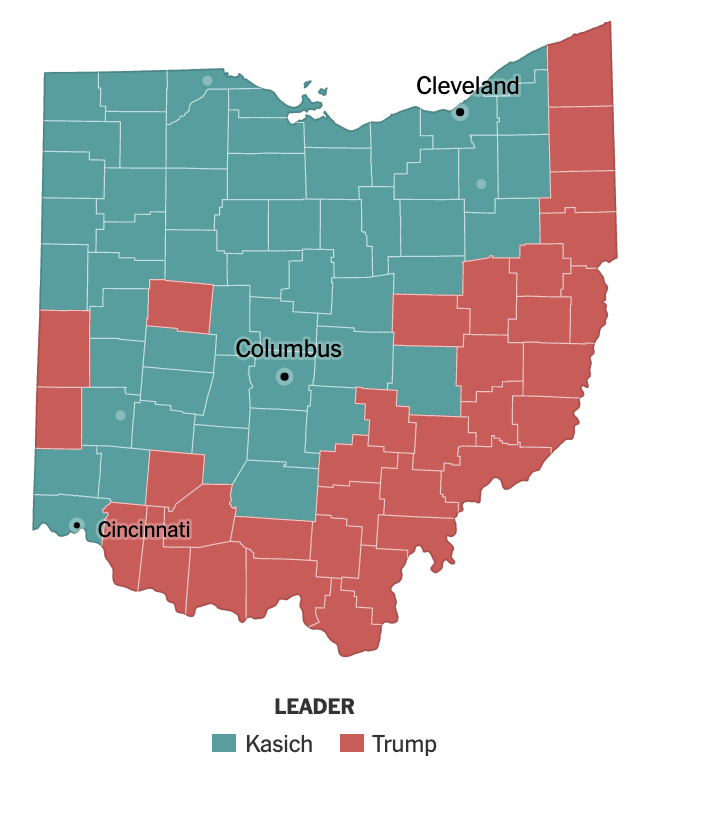
Ohio is an interesting mix here: the northwestern part of the state is more reminiscent of the Upper Midwest; the eastern/southern part of the state is more Appalachian. It was pretty stark in the GOP '16 primary, in fact
Also interesting to compare this to self-reported 2016 vote among validated '16 voters:
Iowa: Trump 50, Clinton 36
Texas: Trump 83, Clinton 12
Georgia: Trump 85, Clinton 13
Looking across all of our polling, you can see an interesting pattern of Dem suburban v. rural gains by region. I think it makes a lot of sense of the shifts we see
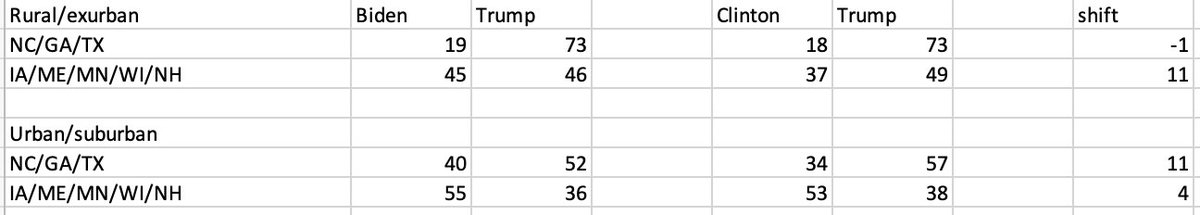
PA is the rare state with some northern metros but kinda southern rural. Bad combo for Biden. A state like AZ--very little rural vote, Sun Belt metro--could be great for Biden, as our poll found. No surprise to see Biden surges in rural north, like our MT poll
Here again, Ohio is an interesting case. It does have plenty of suburbs and you could call them northern, but they are *red* suburbs, unlike PHI, for ex., and that could be the real factor underpinning whether Biden has opportunities for a big breakthrough
I didn't label that clearly btw--but that chart is only among white voters, hence the Trump lead in the metro South
• • •
Missing some Tweet in this thread? You can try to
force a refresh
The NYT/Siena poll is far from perfect - and in general I worry more about people expecting it to be perfect than I worry about it getting insufficient credit.
But the poll is very different from the others - and the differences help explain its record
Staying on the LV question: from its inception until last week's CNN/SSRS state polls (give them applause), the NYT/Siena poll was the only public poll incorporating self-reported vote intention and a model of turnout based no vote history
(in our data, someone's history of voting = more predictive of turnout than self-reported turnout intention -- though blending the two does best of all)
FiveThirtyEight released a new model today, showing Harris with a 58% chance to win. But it's clearly a very different model and I think it's important to hear more about the differences
The previous model made Biden the favorite bc it gave 4:1 weight to fundamentals > polls -- a view that would make Trump stronger today and perhaps still ahead.
Now it gives 4:1 weight to polls > fundamentals -- which would have made Trump a large favorite before
Importantly, the methodology page implies that the model would give more weight to polls > fundamentals all along, so this isn't a function of being one month closer to the election
Kamala Harris puts the Sun Belt back in play, with the race tied across AZ, NC, NV, GA
AZ: Harris 50, Trump 45
GA: Trump 50, Harris 46
NV: Trump 48, Harris 47
NC: Harris 49, Trump 47 nytimes.com/2024/08/17/us/…
The poll basically shows the race returning to "normal," with Harris obtaining far larger margins among Black, Hispanic and young voters, propelling her to nearly a 10 pt gain across the four states nytimes.com/2024/08/17/ups…
I probably wouldn't focus too much on the exact results by state. Individual state polls are a little noisy, and we were bound to get some head-scratchers eventually after conveniently getting identical 50-46 results in each of PA/MI/WI
That said, it is worth noting that the sample does look a little blue. It's about a net-1 pt more Democratic, Dem-leaning and 2020 'Biden compared to the last time we polled these three states in May. This could be an indication of a shift in response patterns, though it could indicate change in attitude as well
I do think the idea of a 'real' 1 pt change in Dem PID/Biden recall, etc., to be fairly plausible. Not only is that a fairly small shift, but no one can deny that the national political environment hasn't changed in a huge way over the last few weeks
Kamala Harris leads Donald Trump, 50-46 among likely voters, in each of Pennsylvania, Wisconsin and Michigan in the first Times/Siena state polls since she became her party's nominee nytimes.com/2024/08/10/us/…
Sometimes, it's hard to explain why things move around. This is time, it's easy: after three extraordinary weeks, Harris is popular.
Her favs are >49 in each state; she does well on every trait we measure.
Trump's favorables are up too -- highest level ever in NYT/Siena polling in these three states. Not enough against a popular opponent. nytimes.com/2024/08/10/ups…
I do think we should treat this a bit like we're in the middle of a convention bump. The huge swing in public opinion over the last few weeks shows that the public's views of her are far from stable. We will see whether this lasts when the going gets tougher for Harris
Trump 48, Harris 47 among likely voters nationwide in our first Times/Siena national poll since Biden left the race nytimes.com/2024/07/25/us/…
It's an ordinary result, but there are a lot of shifts beneath the surface.
-- Trump favorability surges to 48%, up 6 points since post-debate and his highest ever in a Times/Siena poll
-- Harris favorability surges to 46%, up 10 pts since February nytimes.com/2024/07/25/ups…
The poll also shows a return to more familiar demographic patterns.
Harris leads by 21 points among 18-29 year olds, but trails among seniors. She gets 68% of the major party vote among nonwhite voters, making up about half of Biden's underperformance so far this year