Nate Cohn Profile picture
chief political analyst, @nytimes. writing about elections, public opinion and demographics for @UpshotNYT. polling and needling. PNW expat.
33 subscribers
Nov 5 5 tweets 1 min read
Will there be a needle? A quick thread. As you may have read, our colleagues in the Tech Guild are on strike. While they don't play a role in the model itself, they built and maintain the infrastructure that feeds us data and lets us publish on the internet
Nov 3 7 tweets 2 min read
A final point that I *hope* is obvious from the whole of my work, but may not be obvious if you only read individual snippets: I have no idea whether our polls (or any polls) polls be "right", too good for Harris, or too good for Trump.
No one does. This cycle, I've tried to offer real meat to these scenarios with evidence -- not just abstract "30% harris landslide, 30% trump landslide, 40% too close.
If you personally found some of that evidence more convincing than others, that's great. Me? I have no idea
Nov 3 9 tweets 2 min read
The final Times/Siena polls of the campaign show a dead-heat, with Harris gaining along late deciders in the Sun Belt while the Rust Belt tightens
nytimes.com/2024/11/03/us/…Image Whatever happens on Tuesday, the polls suggest that Harris has mostly reassembled the Democratic coalition in the battlegrounds, with Harris still gaining among Black, Hispanic and younger voters It was just a few months ago that we had Trump 9 or 12 pts in GA/NV v. Biden!
Oct 14 9 tweets 3 min read
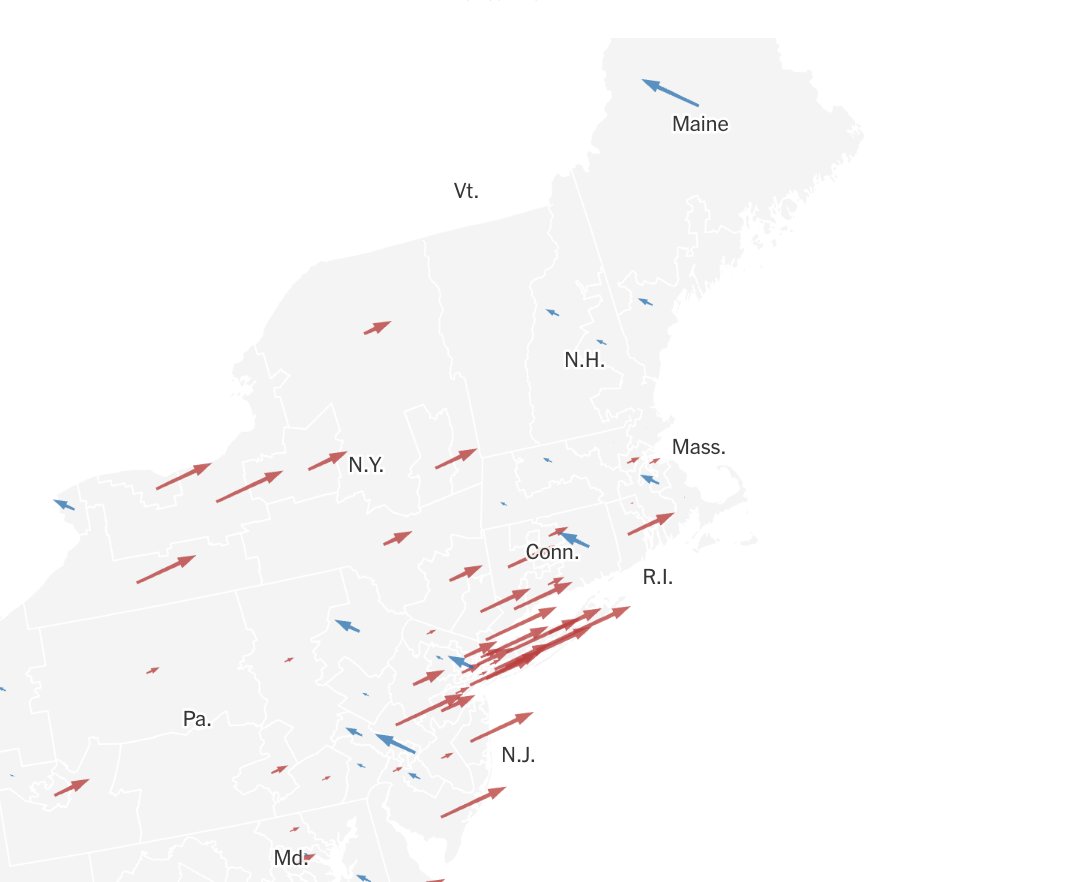
New Jersey stands out to me as a place where we really need a poll
For real! There isn't any polling, there's a lot of evidence that nearby New York is going poorly for Democrats, it's a diverse state, and the New Jersey Democratic showing in 21/22 was not great either
Oct 12 10 tweets 2 min read
A few comments on the Times/Siena polls, based on some replies I see 1. One thing worth keeping in mind in the great 'recall vote' debate is that the decision was made in late 21/early 22.
The reasons were straightforward: it made polls less accurate, including our 2020 polls. It was basically the only way to make them worse.
Oct 12 6 tweets 2 min read
Harris 78, Trump 15 in our Times/Siena oversample of Black voters.
In our 2020 national polls, Biden led 83-6 among Black voters.
nytimes.com/2024/10/12/us/… I'll have more on this soon, but if you're the sort of person squinting at whether Trump will win 13 or 16 percent of the Black vote, it's worth flagging the sensitivity of that kind of question to different definitions of "Black" and varying turnout
Sep 25 5 tweets 2 min read
There are signs that Trump's Electoral College is fading. In our current average, there's just a .7 point gap between the popular vote and the tipping point state
nytimes.com/2024/09/25/ups… Our national Times/Siena polling this year shows a very 2022-like pattern by state.
This pattern holds (if a bit noisier ofc) in our three Harris-Trump polls. Image
Sep 20 4 tweets 1 min read
One question I've seen throughout my replies: does a seemingly strong result for Harris in PA signal a 2020 polling error repeat?
That's obviously hard to say, but I want to flag one thing that caught my eye: our polls do not show Harris doing well with the white working class In PA, it's Trump 61-Harris 34; nationally, it's Trump 67, Harris 30. In each case, that's >= 10 points worse than our final pre-election polls four years ago. It's also worse than the estimated Biden '20 finish with these groups.
Sep 10 6 tweets 2 min read
The NYT/Siena poll is far from perfect - and in general I worry more about people expecting it to be perfect than I worry about it getting insufficient credit.
But the poll is very different from the others - and the differences help explain its record
Staying on the LV question: from its inception until last week's CNN/SSRS state polls (give them applause), the NYT/Siena poll was the only public poll incorporating self-reported vote intention and a model of turnout based no vote history
Aug 23 8 tweets 2 min read
FiveThirtyEight released a new model today, showing Harris with a 58% chance to win. But it's clearly a very different model and I think it's important to hear more about the differences The previous model made Biden the favorite bc it gave 4:1 weight to fundamentals > polls -- a view that would make Trump stronger today and perhaps still ahead.
Now it gives 4:1 weight to polls > fundamentals -- which would have made Trump a large favorite before Image
Aug 17 7 tweets 2 min read
Kamala Harris puts the Sun Belt back in play, with the race tied across AZ, NC, NV, GA
AZ: Harris 50, Trump 45
GA: Trump 50, Harris 46
NV: Trump 48, Harris 47
NC: Harris 49, Trump 47
nytimes.com/2024/08/17/us/… The poll basically shows the race returning to "normal," with Harris obtaining far larger margins among Black, Hispanic and young voters, propelling her to nearly a 10 pt gain across the four states
nytimes.com/2024/08/17/ups…
Aug 10 9 tweets 2 min read
Response rates by party looked fundamentally normal, including in Pennsylvania where we have the best partisanship data out there That said, it is worth noting that the sample does look a little blue. It's about a net-1 pt more Democratic, Dem-leaning and 2020 'Biden compared to the last time we polled these three states in May. This could be an indication of a shift in response patterns, though it could indicate change in attitude as wellImage
Aug 10 4 tweets 2 min read
Kamala Harris leads Donald Trump, 50-46 among likely voters, in each of Pennsylvania, Wisconsin and Michigan in the first Times/Siena state polls since she became her party's nominee
nytimes.com/2024/08/10/us/… Sometimes, it's hard to explain why things move around. This is time, it's easy: after three extraordinary weeks, Harris is popular.
Her favs are >49 in each state; she does well on every trait we measure.
Trump's favorables are up too -- highest level ever in NYT/Siena polling in these three states. Not enough against a popular opponent.
nytimes.com/2024/08/10/ups…
Jul 25 9 tweets 2 min read
Trump 48, Harris 47 among likely voters nationwide in our first Times/Siena national poll since Biden left the race
nytimes.com/2024/07/25/us/… It's an ordinary result, but there are a lot of shifts beneath the surface.
-- Trump favorability surges to 48%, up 6 points since post-debate and his highest ever in a Times/Siena poll
-- Harris favorability surges to 46%, up 10 pts since February
nytimes.com/2024/07/25/ups…
Jul 16 4 tweets 1 min read
Not to be an assignment editor, but at this point I could use a thorough analysis and explanation of the findings of the model, not just a description of the methodology
The findings of the model do not intuitively follow from the description of its methodology. The QT is the latest example: I would have expected an adjustment based on data in other states to hurt Biden in WI, as WI has yielded some of Biden's best numbers this year.
Jul 15 4 tweets 2 min read
Kamala Harris ran ahead of Joe Biden in New York Times/Siena College polls of Pennsylvania and Virginia, taken before the shooting on Saturday.
Biden v. Trump
PA: Trump+3, 48-45;
VA: Biden+3, 48-45.

Harris v. Trump
PA: Trump+1, 48-47
VA: Harris+5, 49-44
nytimes.com/2024/07/15/ups…
Image This is not the first time Harris has run ahead of Biden in our polling. She also ran ahead of Biden in Times/Siena battleground state polls last November. In each case, she outruns Biden among young and nonwhite voters
Jul 8 7 tweets 2 min read
Perhaps the most important poll you've never heard of came out today: the Pew NPORS study, a large mail survey with financial incentives and a 30% response rate. It's important enough that I had to open it when the email arrived.
pewresearch.org/methods/fact-s… The survey is important because it's used as a 'benchmark' -- its results are used as targets for weighting by other polls. Pew uses it to weight their usual surveys, and other polls (like CNN/SSRS, KFF, Ipsos) do too.
(We don't use it, but I do compare it to NYT/Siena data)
Jul 3 4 tweets 1 min read
Donald Trump leads Joe Biden by 6 points among likely voters nationwide in a New York Times/Siena College poll taken after the debate. He leads by 9 points among registered voters.
nytimes.com/2024/07/03/ups… This is a 3 point shift from the Times/Siena poll taken pre-debate -- that's almost exactly the average shift toward the winner of a presidential debate over the last few decades.
The bigger shift in the polling is the one that's been unfolding slowly for four years
Jun 5 4 tweets 1 min read
Previous respondents to recent NYT/Siena surveys shift 2 points toward Biden in post-verdict re-interviews nytimes.com/2024/06/05/ups… A recontacting study involves a trade off: it's less representative, but it confirms shifts at the individual-level.
The folks we recontacted were relatively engaged, educated, whiter, and older than the electorate as a whole -- which may underestimate the swing to Biden
May 14 8 tweets 2 min read
I won't be able to go to @AAPOR (a polling conference) this year, so I want to mention here what I would have liked to have discussed had if I attended:
Vote history. Pollsters have long known that vote history is a strong predictor of propensity to respond to surveys. What's new (at least in Times/Siena data this year) is that it's now an extremely powerful predictor of vote choice, controlling for other variables used in weighting
Apr 13 8 tweets 2 min read
One thing I've been experimenting with since our GOP oversample this summer: weighting our polls by each partisanship subgroup, which has the consequence of ensuring that each subgroup used in weighting has the right number of Dems and Republicans The main downside is that our estimates for self-reported education by voter file party are modeled, and that's something I've had pause about. I'm gradually getting more comfortable with it, as the party x edu tallies for the typically weighted sample seem consistent with subgroup