There is a lot of confusion about carbon budgets and how quickly emissions need to fall to zero to meet various warming targets. To cut through some of this morass, we can use some very simple emission pathways to explore what various targets would entail. 1/11
Much confusion is due to ambiguity of these targets, role of negative emissions, non-CO2 forcings, historical warming, etc. For example, "well-below" 2C target in the Paris Agreement is often interpreted to mean a 66% chance of avoiding >2C warming. carbonbrief.org/analysis-why-t… 2/11
On the other hand, the 1.5C aspirational target is sometimes defined as a 50% chance of limiting warming to 1.5C, and sometimes (as in the new SSP1-1.9 scenario) as a 66% chance of avoidance. 3/11
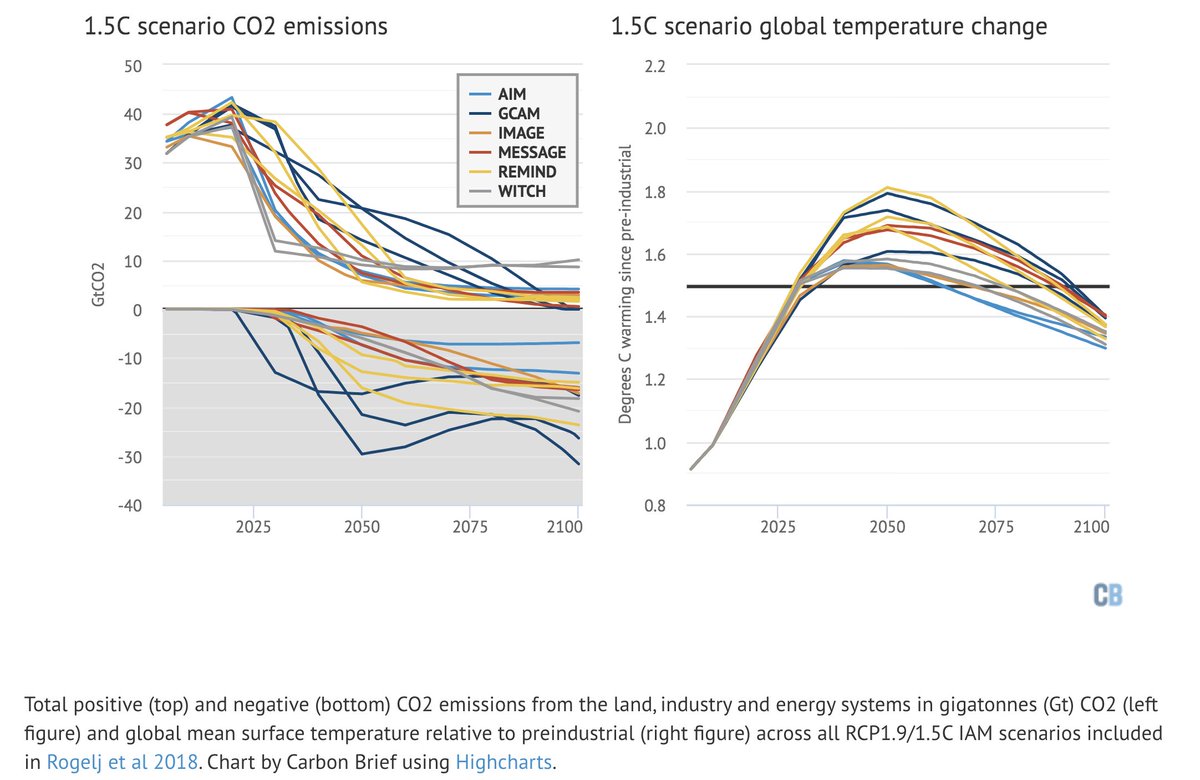
Virtually all scenarios use negative emissions to expand the allowable budget; in the SSP 1.5C scenarios negative emissions effectively increases the size of the 420 GtCO2 budget by between 90% and 380%, allowing positive emissions of between 800 and 1600 GtCO2 by 2100 4/11
But leaving aside negative emissions (and their moral hazards) for the moment, the carbon budgets in the IPCC SR15 report make it relatively simple to calculate when emissions would have to reach zero under different climate targets: 5/11
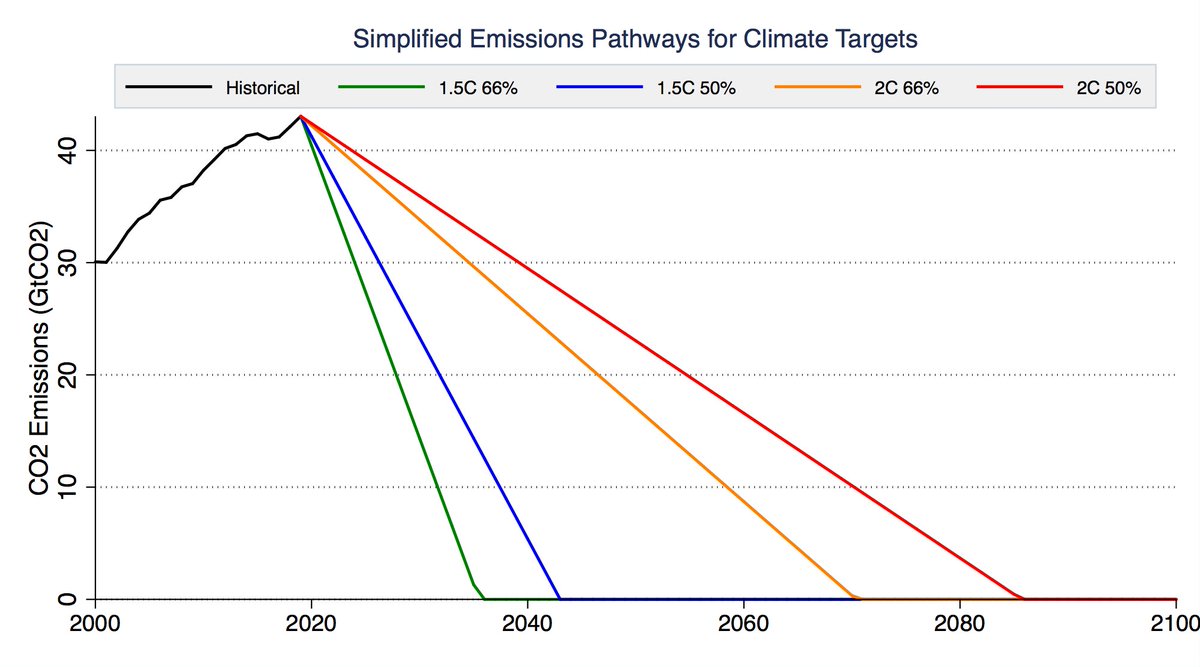
If we assume that emissions simply linearly decrease until they reach zero, and look at four different interpretations of climate targets (66% chance of < 1.5C, 50% of < 1.5C, 66% of < 2C, 50% of < 2C), we get the figure below: 6/11
To have a 66% chance of avoiding 1.5C warming, emissions would have to fall 66% by 2030 and reach zero by 2036. For a 50% chance of 1.5C its a 46% reduction by 2030 and zero by 2043. For 2C 66% (50%) its 21% (16%) reduction by 2030 and zero by 2071 (2085). 7/11
However, these climate model-based budgets do not account for some earth system feedbacks from melting permafrost and methane released from wetlands. The SR15 suggests that including these would reduce all the carbon budgets by around 100 GtCO2. Here is what that looks like: 8/11
In this case to achieve a 66% (50%) chance of avoiding 1.5C, emissions would have to fall 92% (57%) by 2030 and reach zero by 2031 (2039). For a 66% (50%) chance of avoiding 2C warming we'd have to reduce emissions 24% (18%) by 2030 and reach zero in 2066 (2082). 9/11
One big takeaway from these simplified emission pathways is that limiting warming to 1.5C in the absence of planetary-scale negative emissions would be extremely difficult, requiring full decarbonization of the global economy in the next two decades. 10/11
At the same time, the pathways for limiting warming to <2C are much more forgiving, avoiding the need to bet the future on somewhat magical thinking around negative emissions deployment. 11/11
• • •
Missing some Tweet in this thread? You can try to
force a refresh
Every wildfire starts with an ignition – downed powerlines, lightning, arson – and we can do a lot to reduce these.
But in California the number of fires has dropped while the area burned has doubled. What has changed is conditions, not ignitions:
Why have conditions changed? A legacy of poor forest management has led to fuel loading (particularly in the Sierras), contributing to more destructive fires. But vegetation has also gotten much drier as fire season temperatures have warmed (+3.6F since 1980s)
We've historically seen the most destructive fires in hot and dry years. Human emissions of CO2 and other greenhouse gases are the primary cause of increased temperatures in California.
I have a new paper in Dialogues on Climate Change exploring climate outcomes under current policies. I find that we are likely headed toward 2.7C by 2100 (with uncertainties from 1.9C to 3.7C), and that high end emissions scenarios have become much less likely
This reflects a bit of good news; 2.7C is a lot better than the 4C that many thought we were heading for a decade ago, and reflects real progress on moving away from a 21st century dominated by coal. At the same time, its far from what is needed.
It does raise an interesting question: how much of the change in likely climate outcomes relative to a decade ago reflects actual progress on technology and policy vs assumptions about the future (e.g. 5x more coal by 2100) that were always unrealistic.
I have a new analysis over at The Climate Brink exploring how rates of warming have changed over the past century.
Post-1970, GHGs (CO2, CH4, etc.) would have led to just under 0.2C per decade, but falling aerosols (SO2) have increased that rate to 0.25C.
These falling aerosols have "unmasked" of some of the warming that would have otherwise occurred due to past emissions of greenhouse gases. Its been driven by large declines in Chinese and shipping SO2 emissions over the past decade, among other contributors.
Now, a flat rate of warming from GHGs at just under 0.2C per decade might seem a bit unexpected. After all, CO2 emissions have continued to increase, and atmospheric CO2 concentrations have grown year over year.
Theres been a bit of confusion lately around how the climate system response to carbon dioxide removal. While there are complexities, under realistic assumptions a ton of removal is still equal and opposite in its effects to a ton of emissions.
A thread: 1/x
When we emit a ton of CO2 into the atmosphere, a bit more than half is reabsorbed by the ocean and the biosphere today (though this may change as a warming world weakens carbon sinks). Put simply, 2 tons of CO2 emissions -> 1 ton of atmospheric accumulation.
Carbon removal (CDR) is subject to the same effects; if I remove two tons of CO2 from the atmosphere, the net removal is only one ton due to carbon cycle responses. Otherwise removal would be twice as effective as mitigation, which is not the case.
The carbon cycle has been close to equilibrium through the Holocene; we know this because we measure atmospheric CO2 concentrations in ice cores. But in the past few centuries CO2 has increased by 50%, and is now at the highest level in millions of years due to human emissions.
Starting 250 years ago, we began putting lots of carbon that was buried underground for millions of years into the atmosphere. All in all we’ve emitted nearly 2 trillion tons of CO2 from fossil fuels, which is more than the total mass of the biosphere or all human structures:
About a trillion of that has accumulated in the atmosphere, increasing CO2 concentrations to levels last seen millions of years ago. The remainder was absorbed by the biosphere and oceans. We can measure these sinks, and it’s incontrovertible that they are indeed net carbon sinks
We just published our State of the Climate Q2 update over at @CarbonBrief:
⬆️ Now a ~95% chance 2024 will be the warmest year on record.
⬆️ 13 month streak of records set between June 2023 and June 2024.
⬆️ July 22nd 2024 was the warmest day on record (in absolute terms).
⬇️ July 2024 will very likely come in below July 2023, breaking the record streak.
⬇️ The rest of 2024 is likely to be cooler than 2023 as El Nino fades and La Nina potentially develops.
⬇️ Second lowest Antarctic sea ice on record.carbonbrief.org/state-of-the-c…
The past 13 months have each set a new record, with 2024 being quite a bit warmer than 2023 (at ~1.63C above preindustrial levels) in the ERA5 dataset:
However, the margin by which records are being set has shrunk; global temperatures were setting new records by a stunning 0.3C to 0.5C in the second half of 2023, but have been breaking the prior records (set in 2016, 2020, or 2023) by only 0.1C to 0.2C this year: