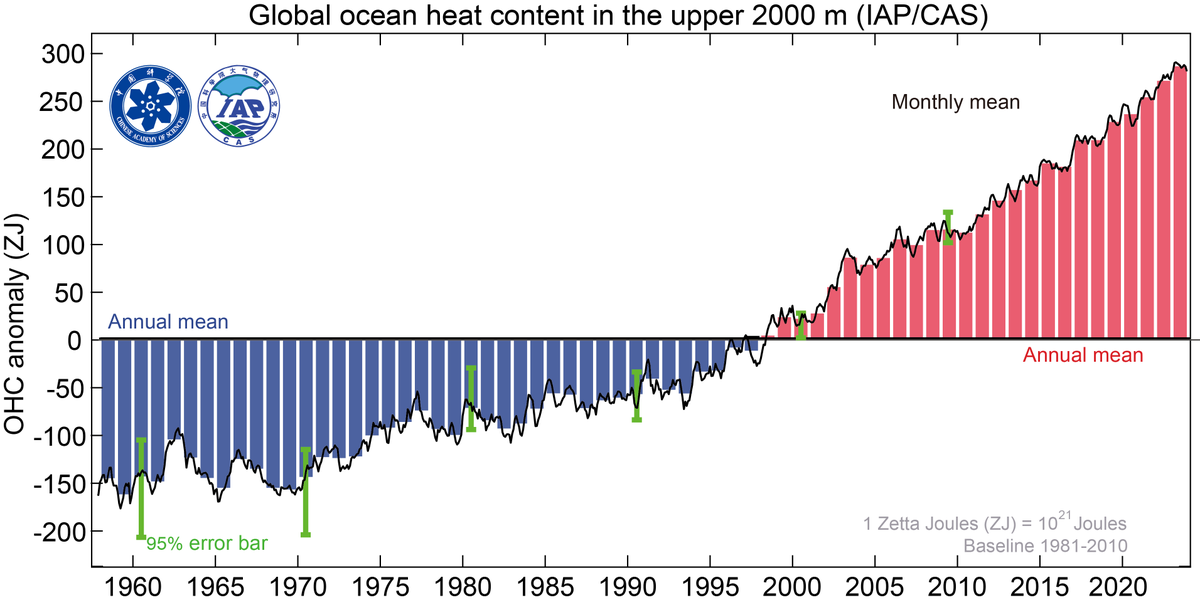
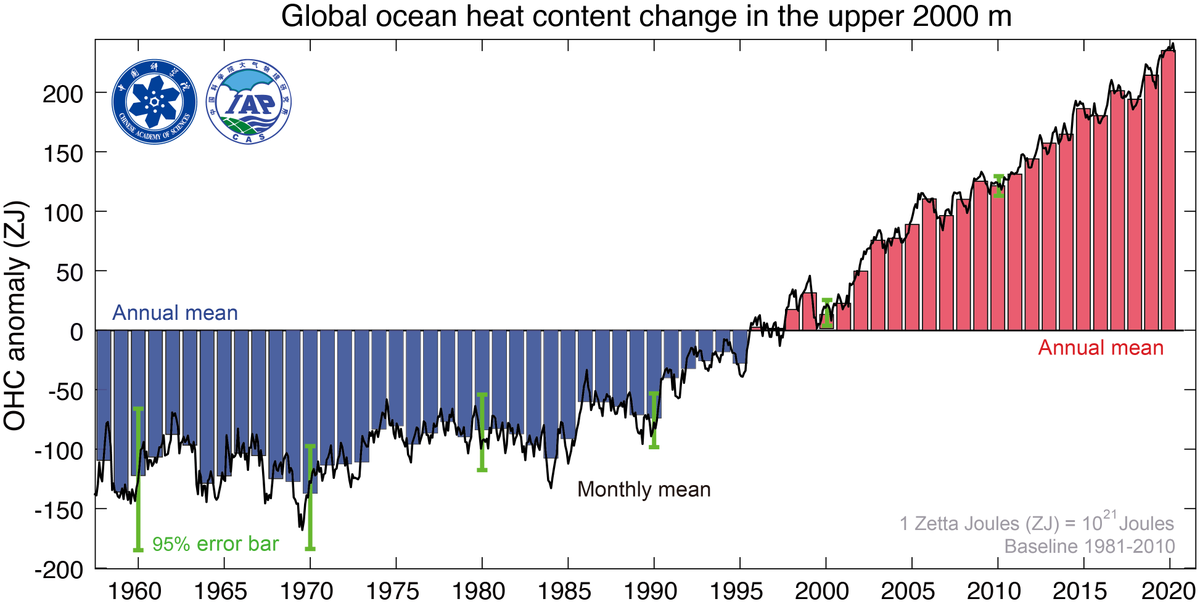
[THREAD 1/9] Please to introduce our new study published in Nature Climate Change: the global ocean has become more stratified and stable since 1960 with global warming: the ocean stratification at upper 2000m has increased by 5.3%. with @MichaelEMannnature.com/articles/s4155…
[THREAD 2/9] Sea water generally forms stratified layers with lighter waters near the surface and denser waters at greater depth (warmer waters atop colder ones). This configuration acts as a barrier to mixing that impacts the efficiency of vertical heat, carbon, oxygen exchanges
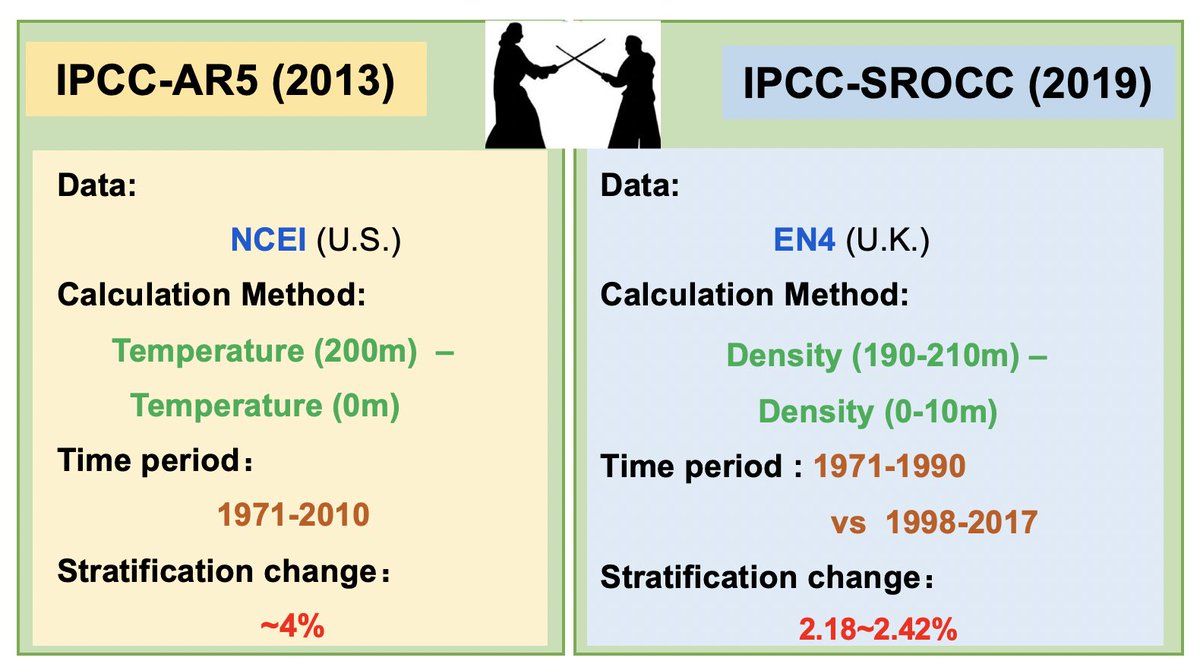
[THREAD 3/9] As human-caused greenhouse warming has altered oceanic temperature and salinity fields, impacts to stratification are expected but the details have been difficult to discern. An example is the different estimates in two recent IPCC reports
[THREAD 4/9] We used a carefully evaluated ocean temperature and salinity data (http://159.226.119.60/cheng/) which overcomes systematic biases associated with horizontal, vertical sampling and instruments. We used buoyancy frequency (N^2) to quantify stratification change
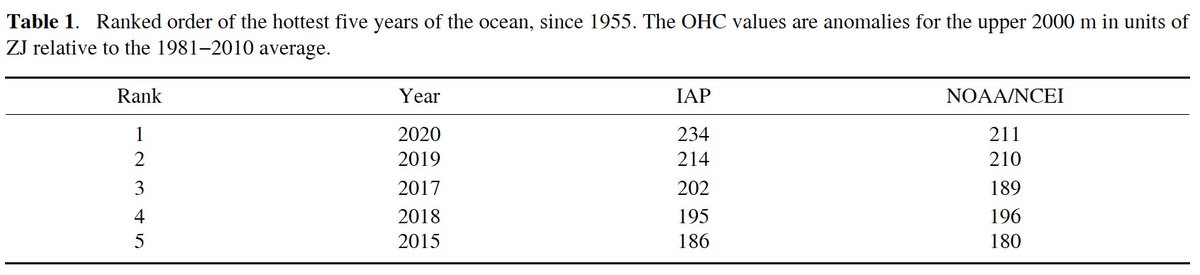
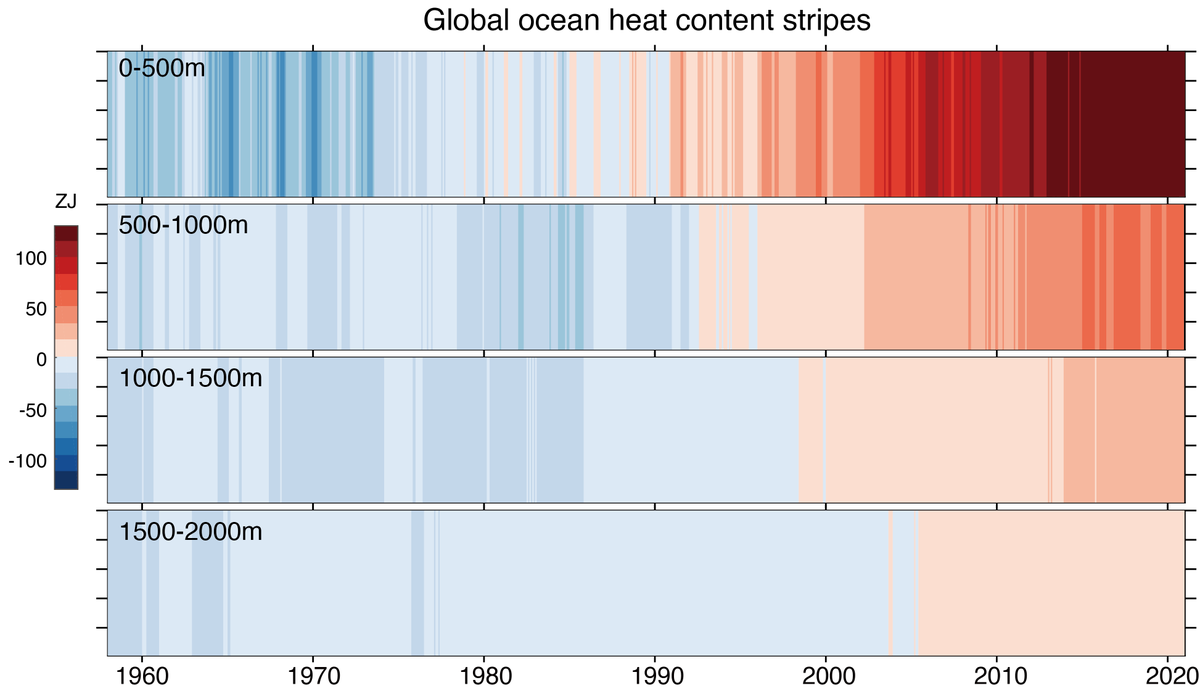
[THREAD 5/9] The new data shows that ocean has become more stratified by ~5.3% since 1960 for the upper 2000m, driven by human activities. Its inter-annual fluctuation is dominated by ENSO variability.
[THREAD 6/9] The stratification increase is deep-reaching: from near surface down to 2000m in the ocean. An even stronger ocean stratification increase, as much as ~18%, has been observed for the upper 150m.
[THREAD 7/9] The observed increasing trend of stratification is mainly caused by stronger ocean warming for upper layers versus the deep oceans, but salinity changes play an important role locally. It is another irrefutable piece of evidence of human-driven global warming.
[THREAD 8/9] Impact: With increased stratification, heat from climate warming cannot penetrate into the deep ocean as readily, which helps to raise the surface temperature. It also reduces the capability of ocean carbon storage, exacerbating the global warming.
[THREAD 9/9] Impact: The increased stratification also prevents the vertical exchanges of nutrients and oxygen, and impacts the food supply of the whole marine ecosystems.
• • •
Missing some Tweet in this thread? You can try to
force a refresh
[1/12] Now 2023 Ocean Data is out! Global 2023 upper 2000 m ocean heat content was the highest ever recorded by modern instruments, 15 ZJ higher than 2022 for IAP data () with a major update of IAP time series since 1940 () doi.org/10.1007/s00376… ocean.iap.ac.cn
[2/12] NCEI/NOAA data show a slightly smaller increase in 2023 OHC compared with 2022 (9 ZJ). The difference is mainly due to data quality control and spatial interpolation methods, the raw data are the same (). ncei.noaa.gov/access/global-…
[3/12] The upper 2000m ocean warming rate is 6.6 ± 0.3 ZJ yr−1 during 1958–2023, 11.4 ± 0.3 ZJ from 1991–2023, and 10.8 ± 1.2 ZJ yr−1 from 2007–2023. The warming rate has increased in the past 7 decades. It is projected to continue at least in the next two decades
[2/11] Ocean warming is a key component of the Earth system, bridging key climate cycles (energy, carbon, and water cycles) through many processes and feedback loops.
[3/11] A thorough assessment on the validity of OHC datasets is done based on recent progress, and we calculate how fast the ocean has warmed. 0-2000m warming began, unequivocally, at least in the 1950s, warming is accelerating with the rate more than doubling from 1960s to 2010s
[1/9] OHC (0-2000m) hits record high in 2021, again, despite La Niña Conditions! The most recent report, authored by 23 researchers at 14 institutes, was published in Advances in Atmospheric Sciences. doi.org/10.1007/s00376…
[2/9] The world ocean, in 2021, was the hottest ever recorded by humans, and the 2021 annual OHC value is even higher than last year's record value by 14 ± 11 ZJ (1 Zetta Joules = 1021 Joules) using the IAP/CAS dataset and by 16 ± 10 ZJ using NCEI/NOAA dataset.
[3/9] The long-term ocean warming is larger in the Atlantic and Southern Oceans. Comparing the spatial OHC anomalies in 2021 versus 2020 shows an imprint of La Niña. The NCEI/NOAA data shows a consistent spatial pattern compared with IAP/CAS.
[1/8] 2020 ocean temperature (heat content) are formally released today by both IAP/CAS and NOAA/NCEI, both data show upper 0-20000m ocean heat content hit record high in 2020. With @MichaelEMann@jfasullo etc. link.springer.com/article/10.100…
[2/8] Differences between the 2020 OHC analyses between IAP/CAS and NOAA/NCEI reflect the uncertainties in the calculation due to method and data coverage. Further quantification of the uncertainties in OHC will help to better specify the confidence in OHC assessment.
[3/8] Over 90% of the excess heat due to global warming is absorbed by the oceans, and the heat has already penetrated into deep layers. Ocean warming is a direct indicator of global warming and the best measure of the Earth’s Energy Imbalance.
[THREAD,1/9] Pleased to inform that our paper “Improved estimates of changes in upper ocean salinity and the hydrological cycle.” published. A new ocean salinity product is available and enables a new estimate on water cycle change. doi.org/10.1175/JCLI-D…@MichaelEMann@jfasullo
[2/9] The new IAP ocean salinity product covers global ocean (0~2000m, 41 levels; 1 deg. spatial resolution, monthly from 1960 to present). The spatial interpolation method is the same to our temperature data, uses the spatio-temporal co-variability of salinity from CMIP5 models.
[3/9] The new product is clearly more reliable for examining long-term salinity changes, as we show that this new salinity reconstruction has much better continuity through changes in the observing-system (from altimeters on satellites and profiling floats (Argo) in the ocean.
[THREAD,1/9] Ocean heat content (0-2000m) data from IAP and NOAA/NCEI was just released, NO surprise, 2019 was the warmest year on record for global ocean. Not only that, the past 5/10 years are the warmest 5/10 years! [link.springer.com/article/10.100…]
[2/9] OHC is one of the key measure of global warming. Human activities emit greenhouse gases (i.e. CO2) into the air, which taps more and more heat in the climate system. Ocean stores more than 90% of the global warming heat!
[3/9] A updated ocean energy budget from 0m to ocean bottom shows a total full-depth ocean warming of 370 ± 81 ZJ (~0.38 ± 0.08 W m^−2) from 1960 to 2019, with contributions of 41.0%, 21.5%, 28.6% and 8.9% from the 0–300, 300–700, 700–2000m, and below-2000m layers, respectively