Justin Fox Profile picture
Sep 28, 2020 8 tweets 3 min read Read on X
At some point after the Covid-19 pandemic fades, mortality rates will drop below normal. But there's not much sign in the data that this is happening yet
bloomberg.com/opinion/articl…
People keep thinking this low-mortality period has already arrived in the U.S. because of the way the CDC reports excess deaths, but the data for the past couple of months are incomplete and CDC efforts to correct for the incompleteness never quite do the trick Image
In fact, because of a change in methods on Sept. 9, the CDC warns that "estimates for the most recent weeks for the US overall are likely underestimated to a larger extent than in previous releases" cdc.gov/nchs/nvss/vsrr… Image
New York City's mortality numbers as reported to the CDC don't seem to have this problem, so here are deaths from all causes for those 85 and older in NYC compared with the past three years' average. A huge increase in spring followed by normal mortality since then Image
A deadly heat wave in France in 2003 gives some indication of what might happen after the pandemic is really over. Deaths among those 85 and older were normal for the rest of the year, then markedly lower in 2004 Image
Here's the current picture in France Image
Anyway there are lots more charts from Europe in the column, but this one from Germany is remarkable. Mortality among those 85+ this spring was lower than in a normal flu season. Definitely not the case in the U.S., or any other large Western European country Image
The European data are available from @EU_Eurostat here ec.europa.eu/eurostat/datab…

• • •

Missing some Tweet in this thread? You can try to force a refresh
 

Keep Current with Justin Fox

Justin Fox Profile picture

Stay in touch and get notified when new unrolls are available from this author!

Read all threads

This Thread may be Removed Anytime!

PDF

Twitter may remove this content at anytime! Save it as PDF for later use!

Try unrolling a thread yourself!

how to unroll video
  1. Follow @ThreadReaderApp to mention us!

  2. From a Twitter thread mention us with a keyword "unroll"
@threadreaderapp unroll

Practice here first or read more on our help page!

More from @foxjust

Sep 9, 2022
Every under-60 age group *except* early 20s and late 30s now has higher labor-force participation and employment rates than in summer 2019 (short🧵on today's column) bloomberg.com/opinion/articl…
Here it is for employment-population ratio. I did a summer-to-summer comparison because (1) most age-group labor stats aren't available seasonally adjusted and (2) they can jump around a lot from month to month
That 20-24 decline is really big! Surely has something to do with interrupted and delayed education, but I hope it goes away soon. The 35-39 drop seems like it should be due to child-care issues, although it's men in that age group who are driving it bloomberg.com/opinion/articl…
Read 7 tweets
Aug 30, 2022
A few months ago, @alexschief pointed out that Minneapolis (population 425,336) was building more housing this year than San Jose, San Francisco, and Oakland combined (population 2.2 million). That's still true, and it's not the only one Image
These are all cities with less than 1 million people that are mostly building new apartments, not single-family houses. It's not an exhaustive list (Tampa, Miami, Arlington, TX, and others also meet the criteria)
Here are the top 10 jurisdictions for housing permits so far this year (permits are reported separately for each NYC borough but I combined them so sue me) Image
Read 5 tweets
Jun 15, 2022
The number of Americans with disabilities is up by about 2 million since before the pandemic. Wonder why that is? bloomberg.com/opinion/articl… Image
The disability increase is sharpest for those who have kept working bloomberg.com/opinion/articl… Image
Here's what the survey-takers ask to get at those disability estimates bloomberg.com/opinion/articl… Image
Read 6 tweets
Jan 18, 2022
Deaths from all causes among working-age Americans were astoundingly, awfully high last summer and fall bloomberg.com/opinion/articl…
The big increase in working-age mortality is mainly Covid-19 deaths ... bloomberg.com/opinion/articl…
Read 7 tweets
Aug 12, 2021
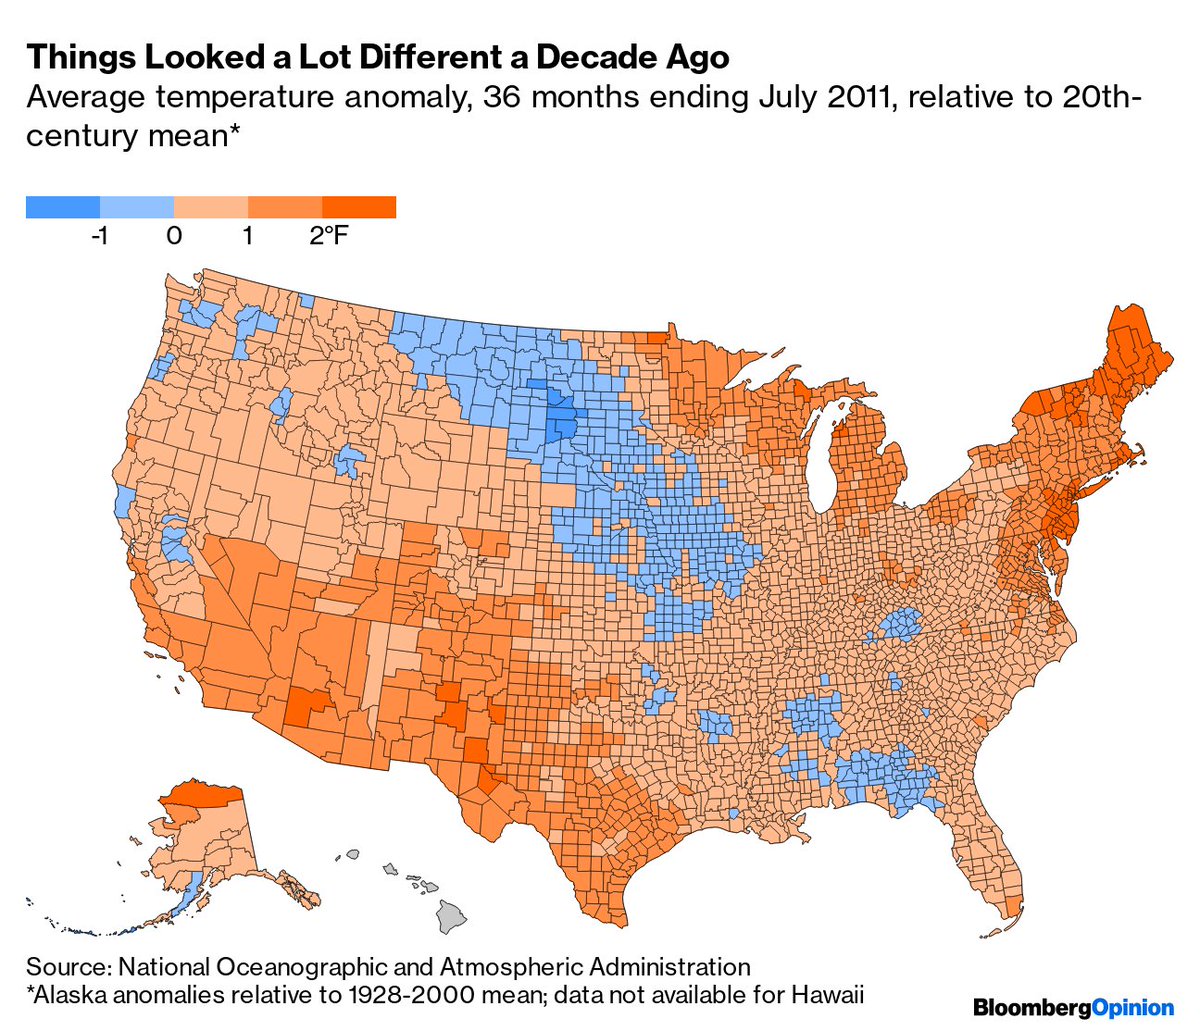
The East and West have been a lot hotter lately than they used to be, the Great Plains not so much bloomberg.com/opinion/articl…
Here's the map from a decade ago ... bloomberg.com/opinion/articl…
... which maybe helps explain why belief that climate change is happening fell in the U.S. in the early 2010s and has risen since bloomberg.com/opinion/articl…
Read 5 tweets
Aug 2, 2021
Last week's GDP release included revisions back to 1999, so it's time for a new set of presidential growth comparisons! Starting with the basic version: annualized growth in real GDP from 1st quarter in office to last bloomberg.com/opinion/articl…
Official quarterly GDP numbers start in 1947, but using annual numbers growth was -7.4% under Hoover, +9.1% FDR and +1.8% Truman. So yes, by this metric Trump has the worst growth record since Hoover bloomberg.com/opinion/articl…
Still, there are other legit ways to measure growth. One would be to shift the GDP measurement forward or back by a quarter. Do the former and Trump pulls ahead of George W. Bush bloomberg.com/opinion/articl…
Read 8 tweets

Did Thread Reader help you today?

Support us! We are indie developers!


This site is made by just two indie developers on a laptop doing marketing, support and development! Read more about the story.

Become a Premium Member ($3/month or $30/year) and get exclusive features!

Become Premium

Don't want to be a Premium member but still want to support us?

Make a small donation by buying us coffee ($5) or help with server cost ($10)

Donate via Paypal

Or Donate anonymously using crypto!

Ethereum

0xfe58350B80634f60Fa6Dc149a72b4DFbc17D341E copy

Bitcoin

3ATGMxNzCUFzxpMCHL5sWSt4DVtS8UqXpi copy

Thank you for your support!

Follow Us!

:(