Justin Fox Profile picture
Columnist @opinion. Eater of free snacks. (Snacks are property of Bloomberg L.P. Tweets aren't.)
davemadden Profile picture 1 subscribed
Sep 9, 2022 7 tweets 4 min read
Every under-60 age group *except* early 20s and late 30s now has higher labor-force participation and employment rates than in summer 2019 (short🧵on today's column) bloomberg.com/opinion/articl… Here it is for employment-population ratio. I did a summer-to-summer comparison because (1) most age-group labor stats aren't available seasonally adjusted and (2) they can jump around a lot from month to month
Aug 30, 2022 5 tweets 2 min read
A few months ago, @alexschief pointed out that Minneapolis (population 425,336) was building more housing this year than San Jose, San Francisco, and Oakland combined (population 2.2 million). That's still true, and it's not the only one Image These are all cities with less than 1 million people that are mostly building new apartments, not single-family houses. It's not an exhaustive list (Tampa, Miami, Arlington, TX, and others also meet the criteria)
Jun 15, 2022 6 tweets 3 min read
The number of Americans with disabilities is up by about 2 million since before the pandemic. Wonder why that is? bloomberg.com/opinion/articl… Image The disability increase is sharpest for those who have kept working bloomberg.com/opinion/articl… Image
Jan 18, 2022 7 tweets 4 min read
Deaths from all causes among working-age Americans were astoundingly, awfully high last summer and fall bloomberg.com/opinion/articl… I'm not the first to remark upon this!
Aug 12, 2021 5 tweets 3 min read
The East and West have been a lot hotter lately than they used to be, the Great Plains not so much bloomberg.com/opinion/articl… Here's the map from a decade ago ... bloomberg.com/opinion/articl…
Aug 2, 2021 8 tweets 5 min read
Last week's GDP release included revisions back to 1999, so it's time for a new set of presidential growth comparisons! Starting with the basic version: annualized growth in real GDP from 1st quarter in office to last bloomberg.com/opinion/articl… 
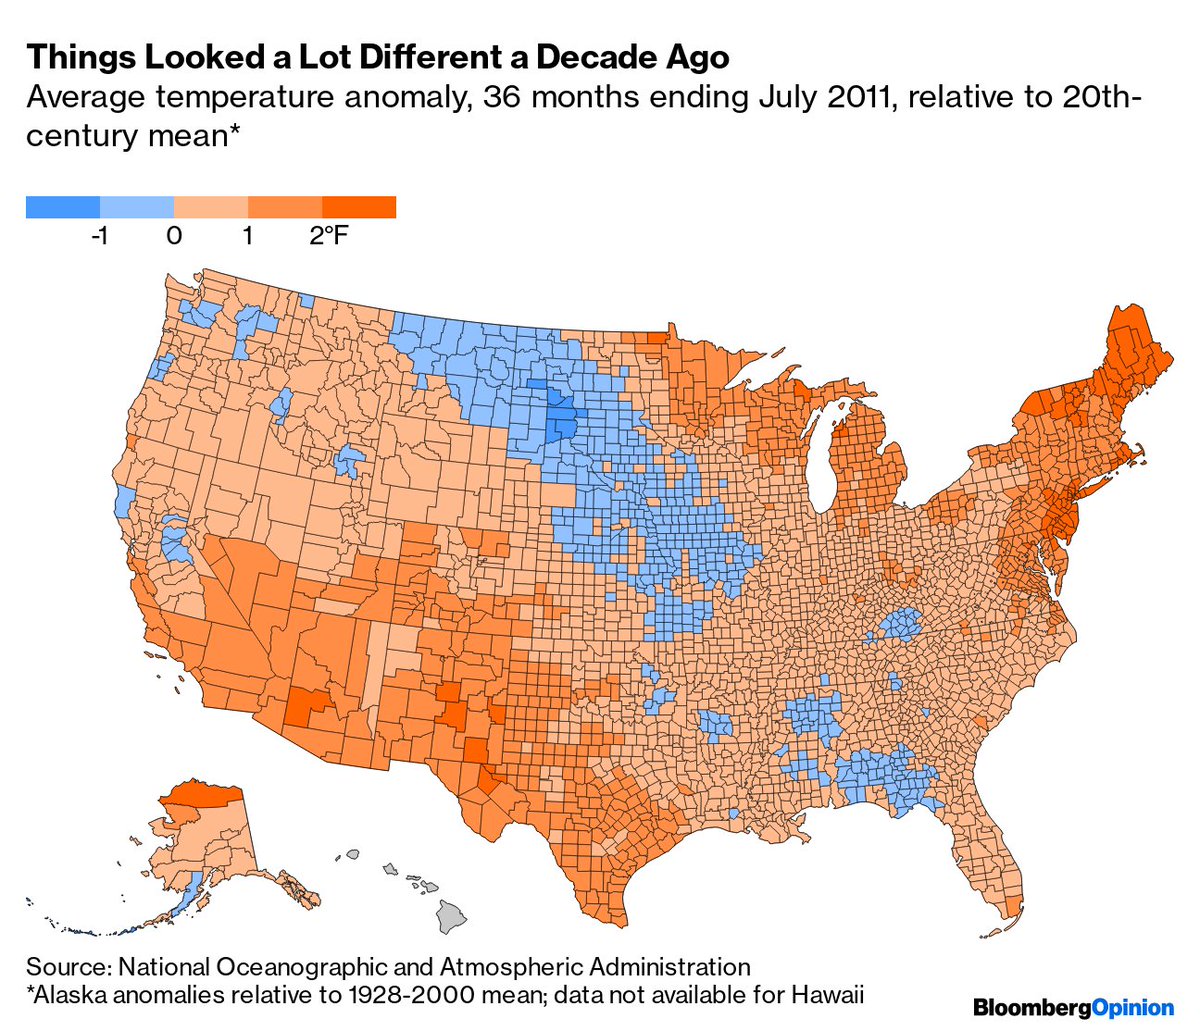
Official quarterly GDP numbers start in 1947, but using annual numbers growth was -7.4% under Hoover, +9.1% FDR and +1.8% Truman. So yes, by this metric Trump has the worst growth record since Hoover bloomberg.com/opinion/articl…
Jul 30, 2021 4 tweets 3 min read
It looks like the NYC murder totals are about to start showing declines relative to 2020 (although definitely not 2019) bloomberg.com/opinion/articl… Shootings will start coming in below the 2020 numbers before long too, if current trends continue, although the undershoot won't be nearly as big bloomberg.com/opinion/articl…
Jul 28, 2021 6 tweets 3 min read
You feeling sleepy yet? bloomberg.com/opinion/articl… Image 
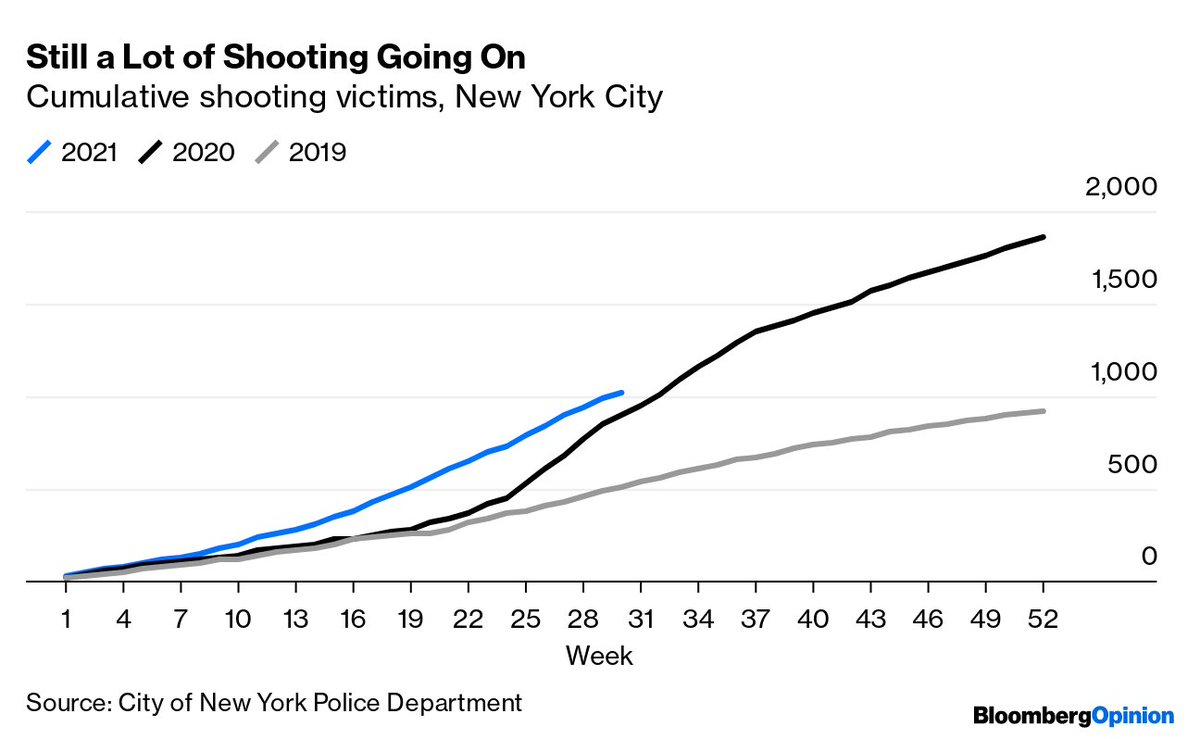
These data, from the American Time Use Survey, include naps and "spells of sleeplessness" and generally come in about an hour higher than other sleep estimates, but the upward trend holds for all age groups under 65 and is probably for real bloomberg.com/opinion/articl… Image
Jul 12, 2021 4 tweets 2 min read
Among the many things you *wouldn't* learn from reading this infographic is that the net worth of the bottom half of the wealth distribution is up 144% since the first quarter of 2008 while that of the top 1% is up 122% nytimes.com/interactive/20… Since the end of 2019 the net worth of the bottom half is up 30.3% while that of the top 1% is up 20.7%, according to the Fed's distributional accounts federalreserve.gov/releases/z1/da…
Jun 18, 2021 10 tweets 5 min read
Make a log chart of U.S. mortality rates by age group going back to 1900, and something really disturbing stands out bloomberg.com/opinion/articl… Image Mortality rates for older Americans had been headed mostly downward for a century until Covid-19 (although 55-to-64-year-olds had seen a slight mortality increase over the past decade) Image
May 6, 2021 5 tweets 3 min read
So there's this weird thing that happens when housing prices go up in cheap places and down in expensive ones bloomberg.com/opinion/articl… Yes, rents are still a lot lower in Florida than California. But when compared to local wages, they stop looking so cheap bloomberg.com/opinion/articl… Image
May 3, 2021 10 tweets 6 min read
As always, I offer answers to your most pressing questions, such as "where do those flowers come from?" bloomberg.com/opinion/articl… Image While Colombia and Ecuador dominate U.S. flower imports, they still trail the Netherlands in global exports bloomberg.com/opinion/articl… Image
Apr 9, 2021 10 tweets 5 min read
Yes, the story is a *lot* different if you go back farther than 2010, but for the past 1/5/10 years the part of the U.S. wealth distribution with the fastest-growing net worth is the bottom half bloomberg.com/opinion/articl… The Great Recession and its immediate aftermath were disastrous for the less-affluent half of America, but the past decade has been tons better bloomberg.com/opinion/articl…
Nov 3, 2020 5 tweets 2 min read
I finally read the article this is based on and … it says that it's not at all clear yet how many of the excess deaths not attributed to Covid-19 are Covid deaths that were misattributed or really the result of other causes "Deaths from circulatory diseases, Alzheimer disease and dementia, and respiratory diseases have increased in 2020 relative to past years, and it is unclear to what extent these represent misclassified COVID-19 deaths or deaths indirectly related to the pandemic"
Oct 13, 2020 6 tweets 2 min read
Re today's Supreme Court decision to let the Census Bureau stop counting: the only states where it hasn't yet enumerated 99.9% or more of housing units are Louisiana (98.3%), Mississippi (99.4%) and South Dakota (99.8%) 2020census.gov/en/response-ra… Also big shout-out to Minnesota for having the highest self-response rate Image
Oct 13, 2020 4 tweets 2 min read
I have inspired a pro-iceberg rant from @davidchang. My work for the year is complete To be sure, my column did mention the possibility that the long iceberg decline was ending, with this 2018 @hels manifesto as the turning point newyorker.com/culture/kitche…
Oct 13, 2020 11 tweets 5 min read
Wrote a column on what may turn out to be the biggest news of 2020, the possible eclipse of head lettuce (iceberg, mainly) by leaf lettuce. With appearances by @hels, Nora Ephron, @AliceWaters, John Waters, @amandamull and (uncredited) @JamesSurowiecki bloomberg.com/opinion/articl… Here's the money chart Image
Sep 28, 2020 8 tweets 3 min read
At some point after the Covid-19 pandemic fades, mortality rates will drop below normal. But there's not much sign in the data that this is happening yet
bloomberg.com/opinion/articl… People keep thinking this low-mortality period has already arrived in the U.S. because of the way the CDC reports excess deaths, but the data for the past couple of months are incomplete and CDC efforts to correct for the incompleteness never quite do the trick Image
Sep 25, 2020 8 tweets 3 min read
I made a column with lots of charts (evergreen Tweet) bloomberg.com/opinion/articl… This year has already broken the record for the number of corporate bankruptcies of $1 billion or more, according to NYU's Edward Altman. But by some other bankruptcy measures it's not a record-breaker at all Image
Sep 17, 2020 13 tweets 5 min read
This isn't going to be any solace for NYC parents who just got the news that schools will be reopening even later than promised, but being stuck at home this year seems to have saved kids' lives. A new column, and a mortality-statistics filled thread 1/n bloomberg.com/opinion/articl… Here are deaths by age group for the U.S. for Feb. 2-Aug. 1 and the more or less equivalent period in 2018 2/n Image
Sep 11, 2020 4 tweets 2 min read
So weird to see NYC held out as an example of how to do things right re Covid-19 but ... here you go The one caveat I'd add to this (excellent) thread is that I do think a higher percentage of New Yorkers than Madrileños have Covid-19 antibodies. In the Comunidad de Madrid (which seems similar to if not identical the metro area) it was ~11.5% in April/May thelancet.com/journals/lance…