1/n
In today's thread, I want to take a look at India's NDC target of reducing the GHG intensity of GDP by 33-35% by 2030, compared to 2005.
I argue that this target is essentially BAU, because India's GHG intensity of GDP is declining as a natural part of development.
Thread
In today's thread, I want to take a look at India's NDC target of reducing the GHG intensity of GDP by 33-35% by 2030, compared to 2005.
I argue that this target is essentially BAU, because India's GHG intensity of GDP is declining as a natural part of development.
Thread
2/n
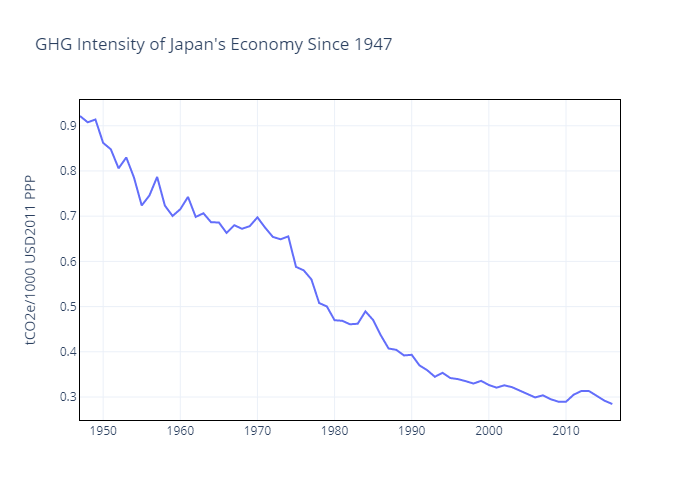
If we take a long run view of the GHG intensity of India's economy since 1947, it can be seen that GHG intensity peaked in about 1985 and has been declining ever since.
Why is this?
If we take a long run view of the GHG intensity of India's economy since 1947, it can be seen that GHG intensity peaked in about 1985 and has been declining ever since.
Why is this?

3/n
Firstly, this pattern is common to developing countries across the long-run development trajectory:
- China
- South Korea
- Thailand
- Japan
All experienced this kind of peak and decline structure (Japan and Thailand somewhat early than I graph here).
Why is this?
Firstly, this pattern is common to developing countries across the long-run development trajectory:
- China
- South Korea
- Thailand
- Japan
All experienced this kind of peak and decline structure (Japan and Thailand somewhat early than I graph here).
Why is this?


4/n
The first explanatory variable is structural change away from agriculture.
We can break down GHG intensity into non-energy GHG and energy GHG intensity of GDP, and plot them separately.
India's non-energy GHG collapsed from 1985 to the present by almost a factor 6 👇
The first explanatory variable is structural change away from agriculture.
We can break down GHG intensity into non-energy GHG and energy GHG intensity of GDP, and plot them separately.
India's non-energy GHG collapsed from 1985 to the present by almost a factor 6 👇

5/n
This is essentially because the share of agriculture in GDP started to decline strongly in the late 1970s and early 1980s, as non-agriculture sectors took off after reforms.
Agriculture is very GHG intensive, because it's low value added and high GWP (CH4, N2O etc)
This is essentially because the share of agriculture in GDP started to decline strongly in the late 1970s and early 1980s, as non-agriculture sectors took off after reforms.
Agriculture is very GHG intensive, because it's low value added and high GWP (CH4, N2O etc)

6/n
You see this pattern everywhere.
For example, in Thailand, where agriculture collapsed from >35% of GDP to about 5%, the non-energy GHG intensity of GDP fell by almost a factor 10 across the period I have data for.
You see this pattern everywhere.
For example, in Thailand, where agriculture collapsed from >35% of GDP to about 5%, the non-energy GHG intensity of GDP fell by almost a factor 10 across the period I have data for.


7/n
The second pattern that we see is that energy intensity of GDP increases early in the development process, and then peaks and declines.
In India this peak of energy intensity occurred in the 1980s, around the time economic reforms made the whole economy more efficient.
The second pattern that we see is that energy intensity of GDP increases early in the development process, and then peaks and declines.
In India this peak of energy intensity occurred in the 1980s, around the time economic reforms made the whole economy more efficient.

8/n
This pattern of peak and decline in energy intensity is repeated in China, South Korea, Thailand, Indonesia, with country-specific factors changing the timing of the peak and the shape and height of the curve.
This pattern of peak and decline in energy intensity is repeated in China, South Korea, Thailand, Indonesia, with country-specific factors changing the timing of the peak and the shape and height of the curve.


9/n
Total GHG intensity is =
Non-Energy GHG/GDP + (Energy/GDP * Carbon / Energy)
Two of these three terms, non-energy / GDP and energy /GDP, decline naturally as part of the development process.
As long as Carbon / Energy doesn't rise, GHG / GDP will go down.
Total GHG intensity is =
Non-Energy GHG/GDP + (Energy/GDP * Carbon / Energy)
Two of these three terms, non-energy / GDP and energy /GDP, decline naturally as part of the development process.
As long as Carbon / Energy doesn't rise, GHG / GDP will go down.
10/n
So what can we expect for India in the future?
1. The share of agriculture will continue to decline -> Non-Energy GHG/GDP will go down.
2. GDP will continue to grow faster than energy consumption -> Energy / GDP will go down.
So what can we expect for India in the future?
1. The share of agriculture will continue to decline -> Non-Energy GHG/GDP will go down.
2. GDP will continue to grow faster than energy consumption -> Energy / GDP will go down.
11/n
3. Carbon / Energy will not rise, and will probably fall.
The biggest uncertainty here has nothing to do with climate policy, but how fast India industrializes.
Energy/GDP rose in China, South Korea and Thailand high investment growth booms in the 1990s or 2000s.
3. Carbon / Energy will not rise, and will probably fall.
The biggest uncertainty here has nothing to do with climate policy, but how fast India industrializes.
Energy/GDP rose in China, South Korea and Thailand high investment growth booms in the 1990s or 2000s.
12/n
If India goes through such a phase, the decline of Energy/GDP could slow.
If, on the other hand, India's industrialization slows down the rate of decline agriculture's share in GDP could slow, which would slow the rate of decline in non-energy GHG/GDP.
If India goes through such a phase, the decline of Energy/GDP could slow.
If, on the other hand, India's industrialization slows down the rate of decline agriculture's share in GDP could slow, which would slow the rate of decline in non-energy GHG/GDP.
13/n
So my conclusions:
1. For emerging countries GHG/GDP is always changing, because GDP is changing.
2. This makes it a bad metric for assessing climate policy stringency.
3. India is likely to blow past is GHG/GDP target because of natural changes in its economy.
So my conclusions:
1. For emerging countries GHG/GDP is always changing, because GDP is changing.
2. This makes it a bad metric for assessing climate policy stringency.
3. India is likely to blow past is GHG/GDP target because of natural changes in its economy.
14/n
4. Climate policy plays a role of course, notably in ensuring continued improvements in energy/GDP and decline in carbon/energy (as is likely to happen in India).
5. Setting intensity targets should consider the natural changes that are already occurring.
End.
4. Climate policy plays a role of course, notably in ensuring continued improvements in energy/GDP and decline in carbon/energy (as is likely to happen in India).
5. Setting intensity targets should consider the natural changes that are already occurring.
End.
15/n
Data sources:
1. Long-run GHG: Primap.
2. Long-run GDP: Maddison
3. Energy consumption and energy CO2: BP.
4. Agriculture share in GDP: World Bank.
Data sources:
1. Long-run GHG: Primap.
2. Long-run GDP: Maddison
3. Energy consumption and energy CO2: BP.
4. Agriculture share in GDP: World Bank.
• • •
Missing some Tweet in this thread? You can try to
force a refresh