Ed Conway Profile picture
Sep 30, 2020 16 tweets 7 min read Read on X
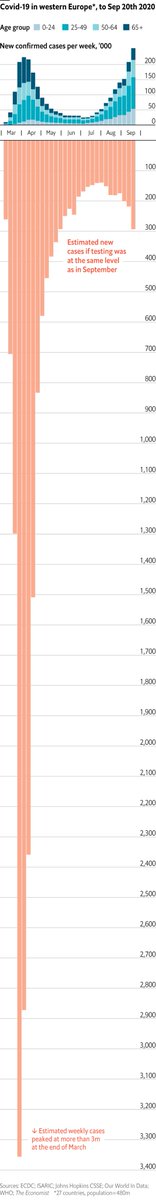
One problem with using #COVID19 trajectories to work out where we may be heading is question marks over the data - something illustrated brilliantly by this chart via @AlexSelbyB. Official case numbers look v v high now, but we weren't measuring cases v well back in spring. Image
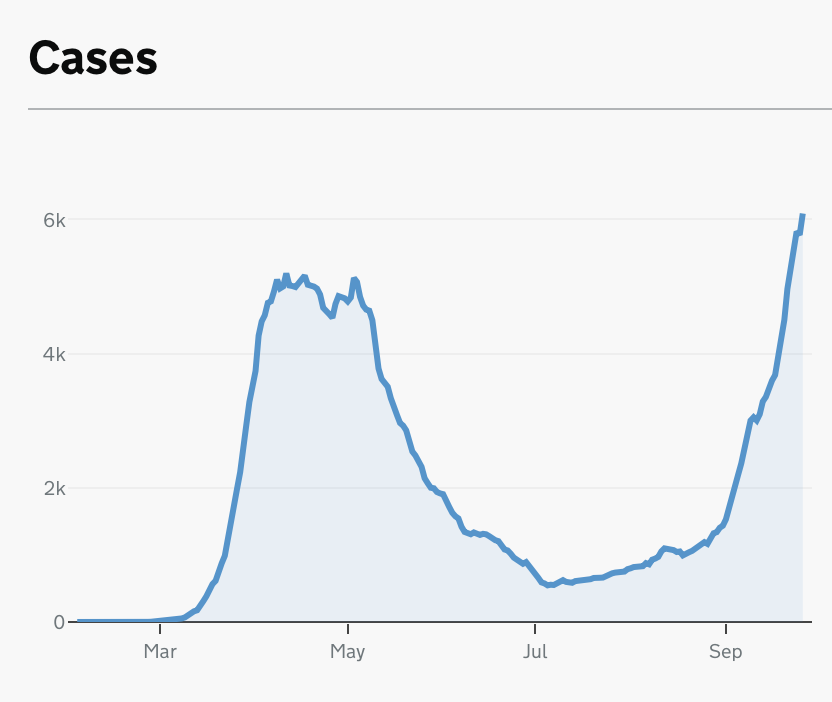
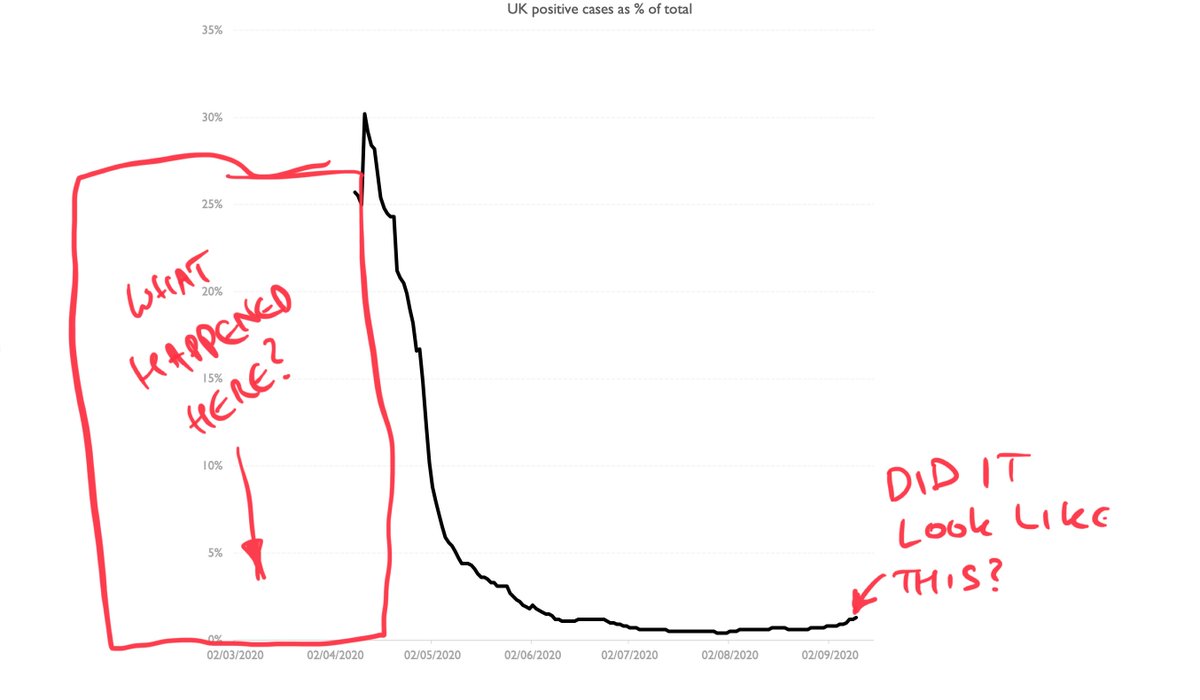
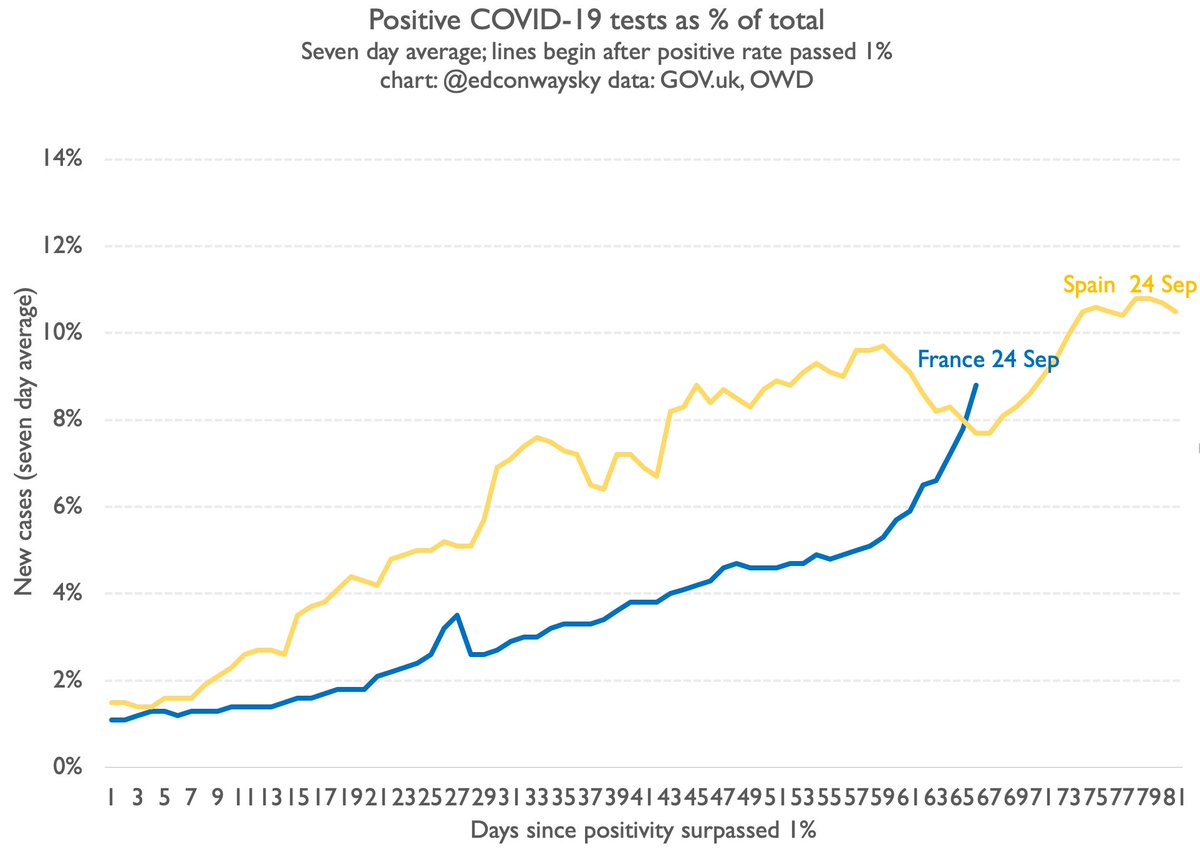
Upshot is charts of cases alone are of limited use - and this is before you get to questions about whether the testing figs are reliable. We could look at positive tests as % of total (chart 2). It adjusts for fact we're doing more testing. But is that early data reliable? ImageImage
The best measure of #COVID19 prevalence in England is prob the @ONS infection survey but again: it started after the peak. And right now what we REALLY need to gauge is not post peak but the run up to the peak Image
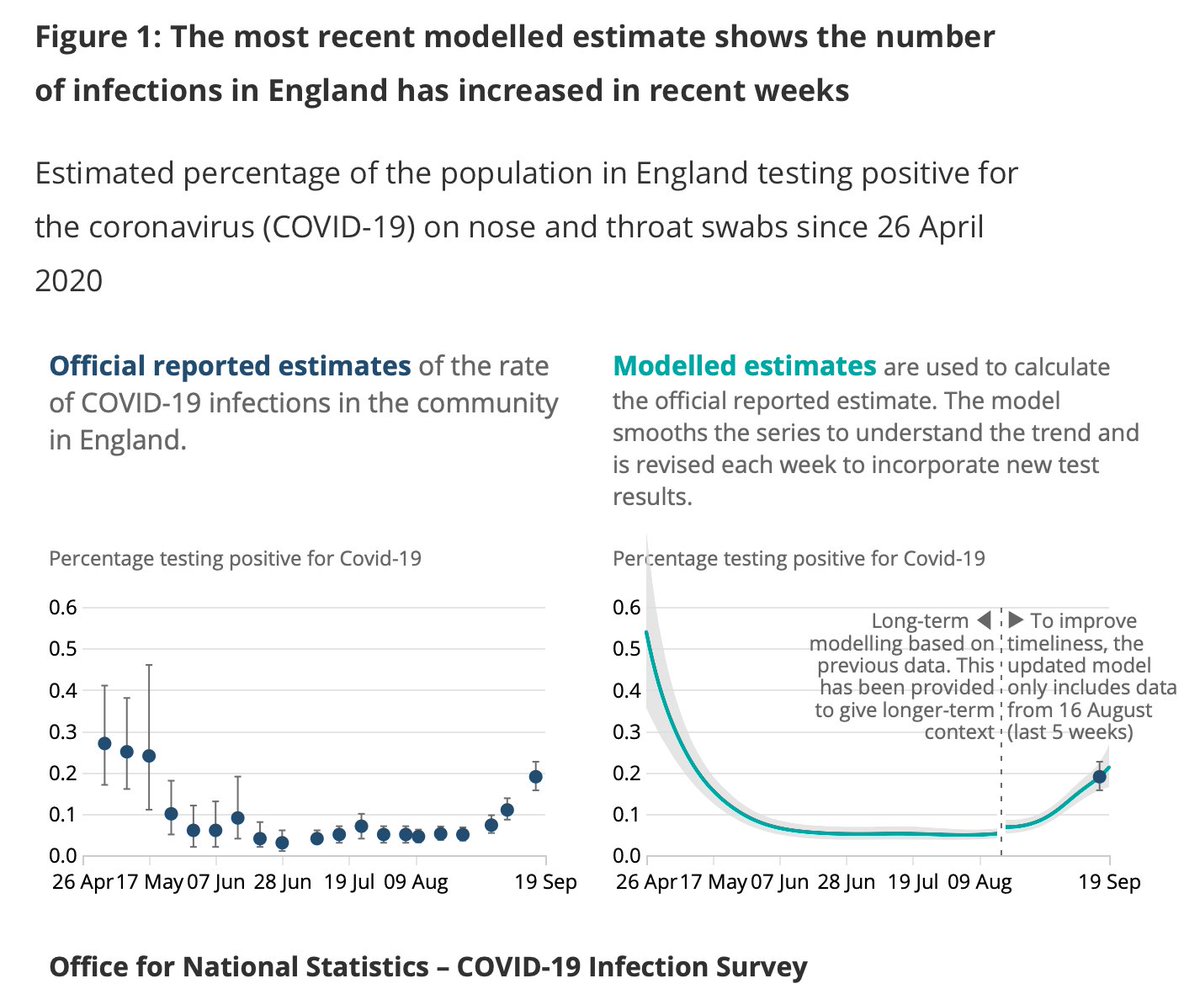
The great unknown (and there are theories abt this but not much data) is whether the bit BEFORE the data we have on cases/positivity looked anything like what we are going through NOW. To me - someone watching this purely through a data prism - this seems really, really important Image
Now, eventually we will know because the early data on deaths are far more reliable (for all their faults) than the case data. The problem is by the time we notice we're on the same path it will almost certainly be too late. So we certainly shouldn't just focus on deaths.
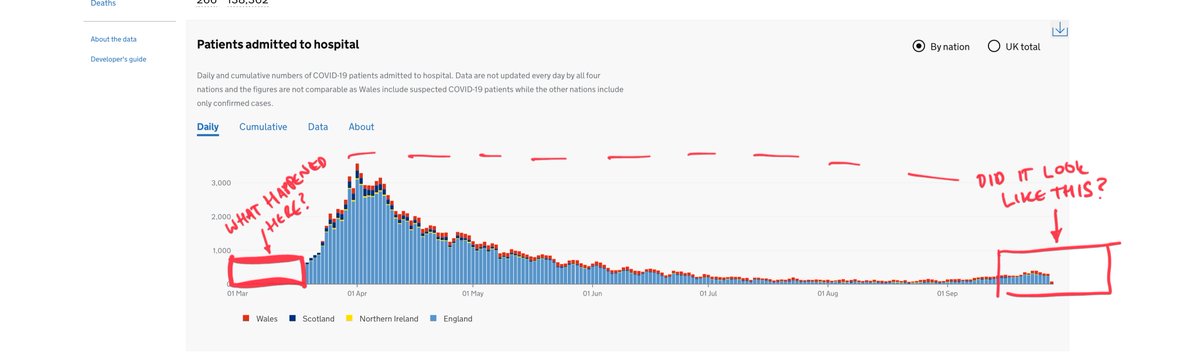
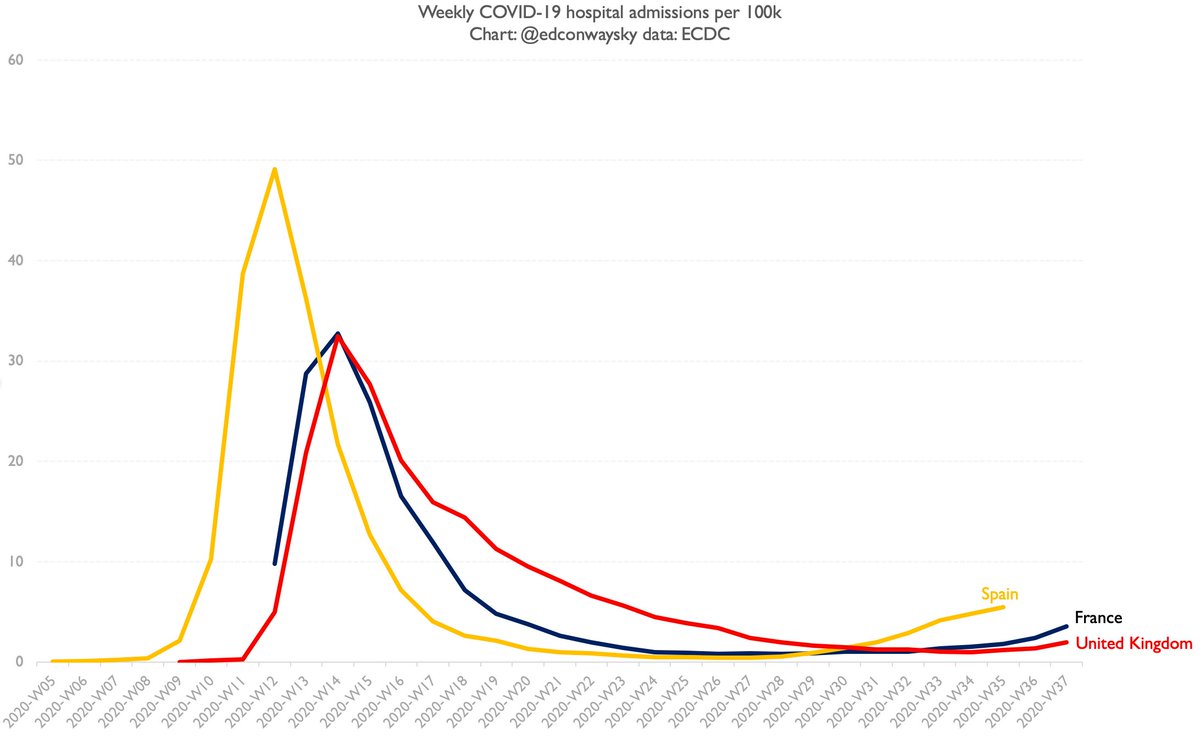
What about hospitalisations data? Again, a bit patchy since there's a big gap at that start which begs the same question again: what was happening in those early weeks? Is it similar to what we're going through now or v different? Image
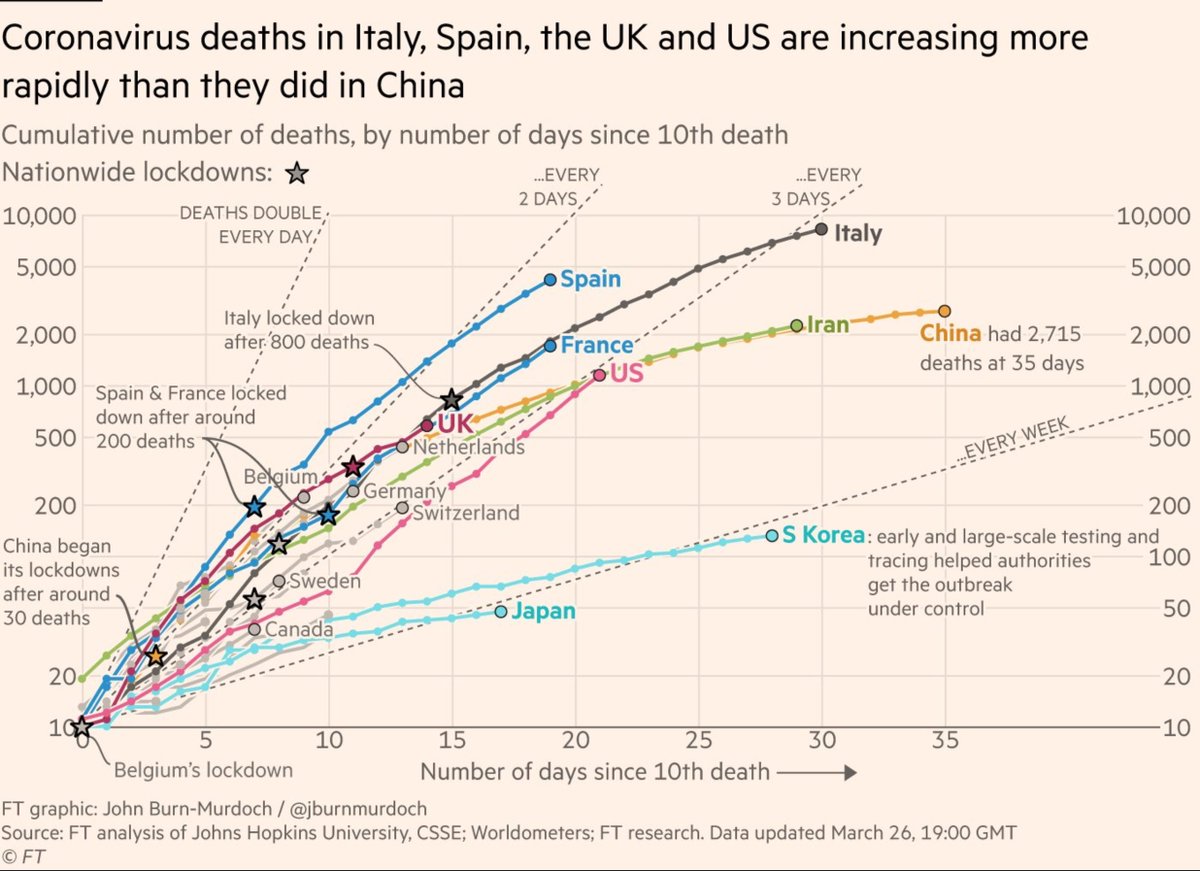
All of these unsettling gaps are why it's also worth looking not just at our own past but at our plausible future. This is why we focused so much on Spanish/Italian trajectories last time around. The disease seems to spread in the same way in most medium-sized countries.
Sadly last time around the most reliable cross-country comparisons were of deaths because of those 👆data gaps. This time around the case data is better (not brilliant, but better), so we can compare our trajectory to other countries going through similar outbreaks. Image
All of which is a long winded way of explaining why I keep updating this chart. And why I was a bit sceptical about @uksciencechief's chart last week suggesting the UK outbreak could go in a v different direction. From early on in this outbreak we've been following France/Spain Image
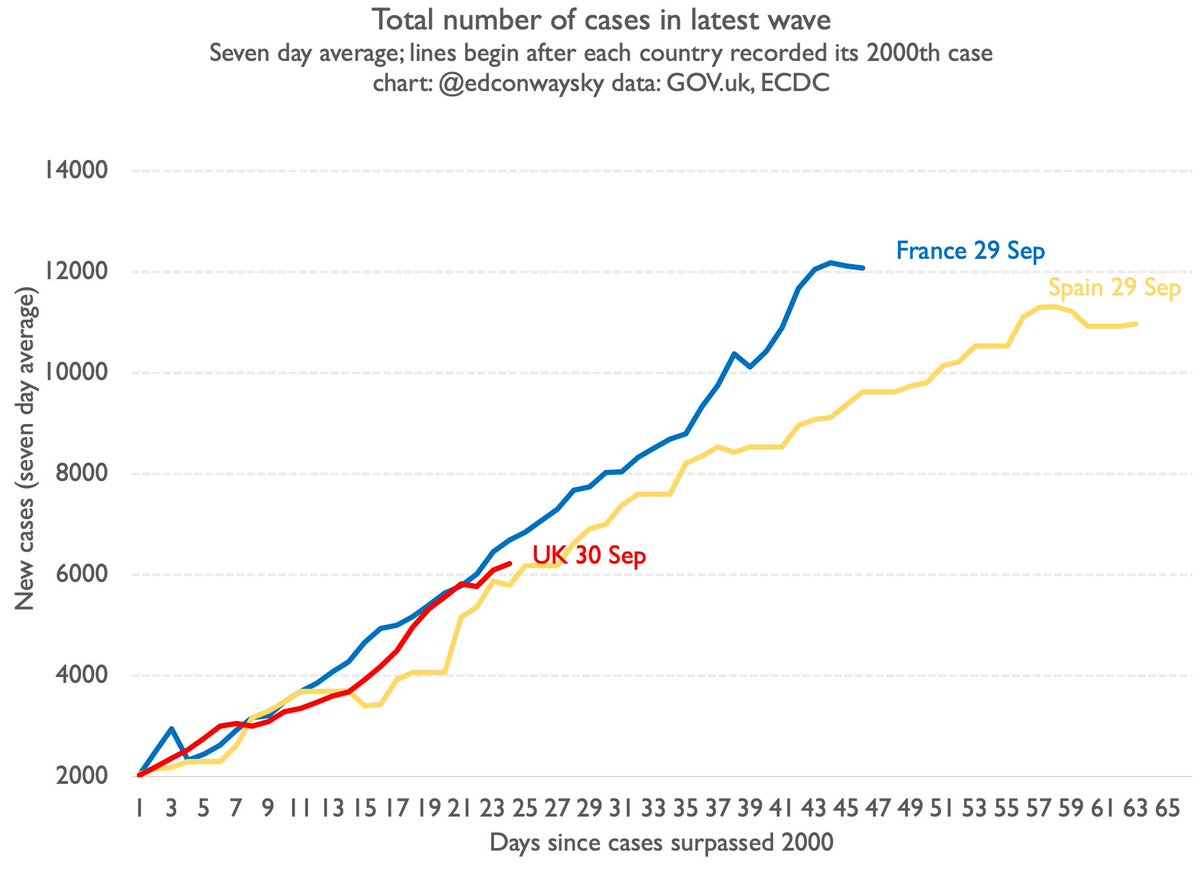
If this continues - and it's a big if, but it is what happened in the last outbreak and seems to be happening thus far this time too - we can potentially look at other data from France/Spain to try to fill in those gaps in the cases/hospitalisations charts above...
So far the paths they're following in France/Spain look different to spring. Look at hospitalisations. Crucially, these data should be more reliable at depicting those intense spring months than case data. And the increase in recent weeks is more gradual than Feb/March Image
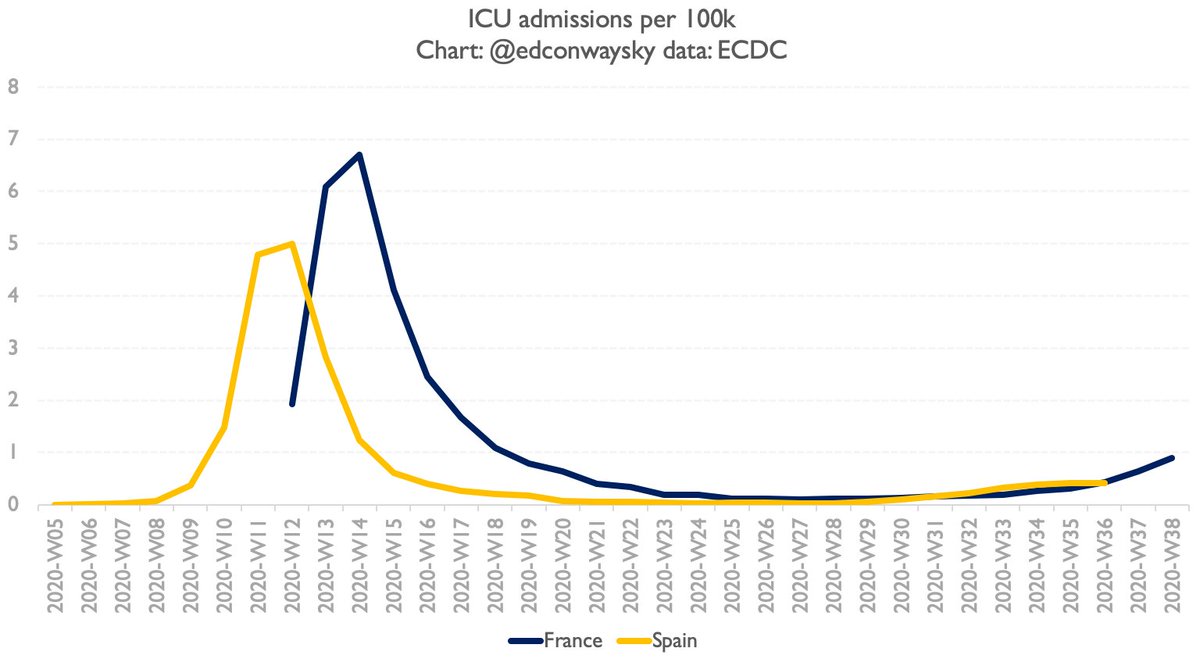
Here's ICU admissions. Similar picture. Now I don't think these charts alone fill in the gaps we have in that early data yet. But in a few weeks they might have. If they start to spike then it looks probable UK will too. If they don't then UK may not. Image
Early signs are broadly promising: the 7day average daily new cases in France and Spain is no longer rising and has actually fallen a bit in the past day or two. In Spain the % of positive tests also seems to have peaked. Then again it's still rising fast in France Image
It's too early to be certain this is not a repeat of the first wave. But much of the data thus far seems to be consistent with that. Why? Restrictions? Mask wearing? Better treatments? Better shielding? Or way too early to say? My vote is def for the latter...
Most striking thing from today's press conference? @CMO_England admitting the govt underestimated the doubling time of #COVID19 in the first wave. It's true. And I'd argue it was in part because they paid too little attention to what was happening in Italy/Spain/France.
The next question is whether the response to having messed up last time is to swing entirely in the other direction (assume cases are heading through the roof) or to pay more attention to European epidemiology. I'd argue the latter - as I lay out in the thread above. 👆

• • •

Missing some Tweet in this thread? You can try to force a refresh
 

Keep Current with Ed Conway

Ed Conway Profile picture

Stay in touch and get notified when new unrolls are available from this author!

Read all threads

This Thread may be Removed Anytime!

PDF

Twitter may remove this content at anytime! Save it as PDF for later use!

Try unrolling a thread yourself!

how to unroll video
  1. Follow @ThreadReaderApp to mention us!

  2. From a Twitter thread mention us with a keyword "unroll"
@threadreaderapp unroll

Practice here first or read more on our help page!

More from @EdConwaySky

Mar 18
NEW
Britain's motoring lobby group the @SMMT has insisted that an unprecedented 2,000% increase in car exports to Azerbaijan has NOTHING to with Russia and is explained by the fact that this former Soviet state is a “flourishing market in its own right”.
This is rather... odd
🧵 Image
Before we get onto that, some background (thread on this here👇).
TLDR: UK car exports to Russia have collapsed, because of sanctions. But UK car exports to countries neighbouring Russia have suddenly risen by nearly the same amount. Esp Azerbaijan
Following my original report we now have new figs on UK car exports.
They show flows to Azerbaijan have continued. £42m in Jan. 3rd highest EVER.
Now there's no way of being 100% sure what's going on here. you can't track consignments beyond Azerbaijan (if they ever reach Az) Image
Read 13 tweets
Mar 12
🚨The strange tale of British luxury cars & Russian sanctions🚨
🧵A thread on some v striking charts which raise some disturbing questions abt the car industry.
Let's start at the start.
Wealthy Russians love high-end British cars.
Don't just take it from me. Take it from her 👇
So when Russia invaded Ukraine, it was not without significance that all Britain's major carmakers said they would stop sending their cars to Russia.
Anyway, shortly afterwards, the UK imposed sanctions which made it illegal to do so anyway...
There are two sanctions of note here.
First, UK companies cannot send "dual use" items to Russia which could be turned into weapons.
Second, there was a specific ban on the sale of any car over £42k👇
So it's pretty simple. No cars. Esp not luxury cars. legislation.gov.uk/uksi/2022/452/…
Image
Read 15 tweets
Mar 6
💷BUDGET THREAD💷
A few thoughts on what was supposed to be a big event but ended up feeling, well, a wee bit thin.
And that’s the first thing to say.
Strikingly, this Budget was HALF as big as the Autumn Statement. Look at the difference between the scorecard totals 👇
Image
Image
Was it a tax-cutting Budget?
I mean… not really.
Well, OK, the net impact is taxes aren’t going up as quickly as they were 6 months ago.
But (and I think this is pretty crucial) THEY’RE STILL GOING UP. The tax burden will be higher at the end of this Parliament than before.
Here’s a good illustration of that.
The bars here show you the impact, across the economy, of the decision a few Budgets ago to freeze tax allowances. The bars are in negative territory.
People are paying more in taxes as they get dragged into higher thresholds… Image
Read 14 tweets
Feb 23
🧵Here's a thread about an obscure economic theory from a century and a half ago, which is about to become a MASSIVE deal.
⚡️It helps explains why tackling climate change is going to be v v hard. Some say impossible.
The story begins with this building👇
Yes it's the @SphereVegas.
Not just a massive entertainment venue but also the world's biggest screen. By all accounts it's an amazing spectacle both outside and in, where there's also a ginormous wraparound LED screen (also one of the biggest anywhere)
Get up close to that enormous exterior screen & it looks v different.
You see an array of little glowing pucks, each one decked with 48 light emitting diodes (LEDs). These act as the "pixels" of the image you see from miles around. These things are magic businessinsider.com/what-the-las-v…
Image
Read 32 tweets
Feb 21
🚨How British companies are bolstering Vladimir Putin’s war machine🚨
A depressing thread.
But an important one.
With some pretty shocking charts.
Let’s begin with the “official” picture. It suggests UK trade with Russia has collapsed since Feb 2022. Down by 74%… Image
Now let's fill in the data.
Look how we're no longer exporting cars or heavy machinery to Russia. Because the govt is well aware this stuff could be repurposed into weapons. So the official line is that this is a big success story.
Looks like Russia's economy is being starved Image
But clearly the Russian economy isn't doing as badly as all that. Indeed Russia is due to grow faster than any G7 nation this year 👇
And that's just the economy. Now look at the battlefield and Russia is looking v strong. No shortage of weapons/drones etc despite sanctions
Why? Image
Read 17 tweets
Jan 20
With Tata steel having just confirmed the closure of the two blast furnaces at Port Talbot, here are a few important datapoints.
First, UK steelmaking has collapsed faster, over the past half century, than ANY other country in the world save for Venezuela.
Pretty shocking👇 Image
The Tata plan is to replace the two blast furnaces with two electric arc furnaces.
There are some strong arguments - not all of which come back to net zero.
One is that Britain produces more than enough scrap steel to satisfy its needs. At the moment this is mostly exported Image
Electric arc furnaces exist to RECYCLE steel via a massive electric current.
UK has long been an outlier in having v few of them. Look: less, proportionally, than nearly any other country in the world.
Essentially we stuck with blast furnaces far longer than most other nations... Image
Read 10 tweets

Did Thread Reader help you today?

Support us! We are indie developers!


This site is made by just two indie developers on a laptop doing marketing, support and development! Read more about the story.

Become a Premium Member ($3/month or $30/year) and get exclusive features!

Become Premium

Don't want to be a Premium member but still want to support us?

Make a small donation by buying us coffee ($5) or help with server cost ($10)

Donate via Paypal

Or Donate anonymously using crypto!

Ethereum

0xfe58350B80634f60Fa6Dc149a72b4DFbc17D341E copy

Bitcoin

3ATGMxNzCUFzxpMCHL5sWSt4DVtS8UqXpi copy

Thank you for your support!

Follow Us!

:(