Week 17 Test & Trace data summary. 17/09/20 – 23/09/20.
Not a pretty picture.
Cases ⬆️61%.
Tests ↔️
Test positivity rate ++⬆️from 3.3% to 5.3% (+ some useful detail by age)
Test and Trace performance worse.
gov.uk/government/pub…
Summary in picture, detail in thread 👇
Not a pretty picture.
Cases ⬆️61%.
Tests ↔️
Test positivity rate ++⬆️from 3.3% to 5.3% (+ some useful detail by age)
Test and Trace performance worse.
gov.uk/government/pub…
Summary in picture, detail in thread 👇
Despite no change in number of tests,
- cases in pillar 1 ⬆️34% from 3,653 to 4,898 (NHS/PHE labs – outbreaks/hospital)
- cases in pillar 2 ⬆️67% from 15,853 to 26,475 (community)
Means positivity for pillar 2 ⬆️from 3.3% to 6.7%
And pillar 1 ⬆️from 1.8% to 2.5%
- cases in pillar 1 ⬆️34% from 3,653 to 4,898 (NHS/PHE labs – outbreaks/hospital)
- cases in pillar 2 ⬆️67% from 15,853 to 26,475 (community)
Means positivity for pillar 2 ⬆️from 3.3% to 6.7%
And pillar 1 ⬆️from 1.8% to 2.5%


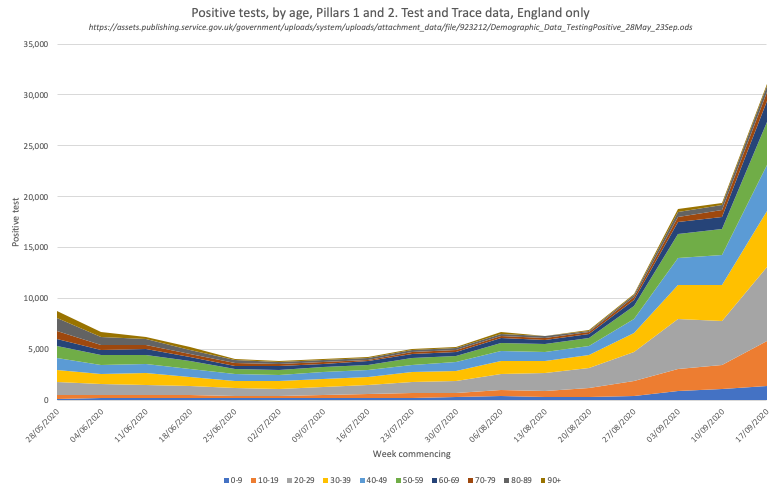
And like @PHE_uk surveillance, they now give data by age
Case numbers still dominated by 20-29/yr olds, but growth in cases across all ages (except 90+)
And there are big differences by age, steep rises across all age gps b/w 20-70yrs
0-19yrs much less change in positivity rate
Case numbers still dominated by 20-29/yr olds, but growth in cases across all ages (except 90+)
And there are big differences by age, steep rises across all age gps b/w 20-70yrs
0-19yrs much less change in positivity rate

And despite smaller numbers, older people are now in hospital and intensive care
https://twitter.com/ADMBriggs/status/1309552296922099712?s=20
Rising test positivity may be due to prioritising tests for those with symptoms alongside the known large rises in cases in the community....
...REACT-1 survey (up to 26th Sept) says positivity rate in community is 0.55%, 411,000 people; ONS says it is about a quarter of this (104,000 people, up to 19th Sept) but that's still 9,600 new cases a day. Age profile largely similar to T&T.
https://twitter.com/ADMBriggs/status/1311582676219056128?s=20
Would be v interesting to see case numbers by age for each pillar separately to see if sheds any light on hospital use/outbreaks etc. PHE data suggest that still care homes and educational settings main settings for managed outbreaks.
https://twitter.com/ADMBriggs/status/1309552276621668355?s=20
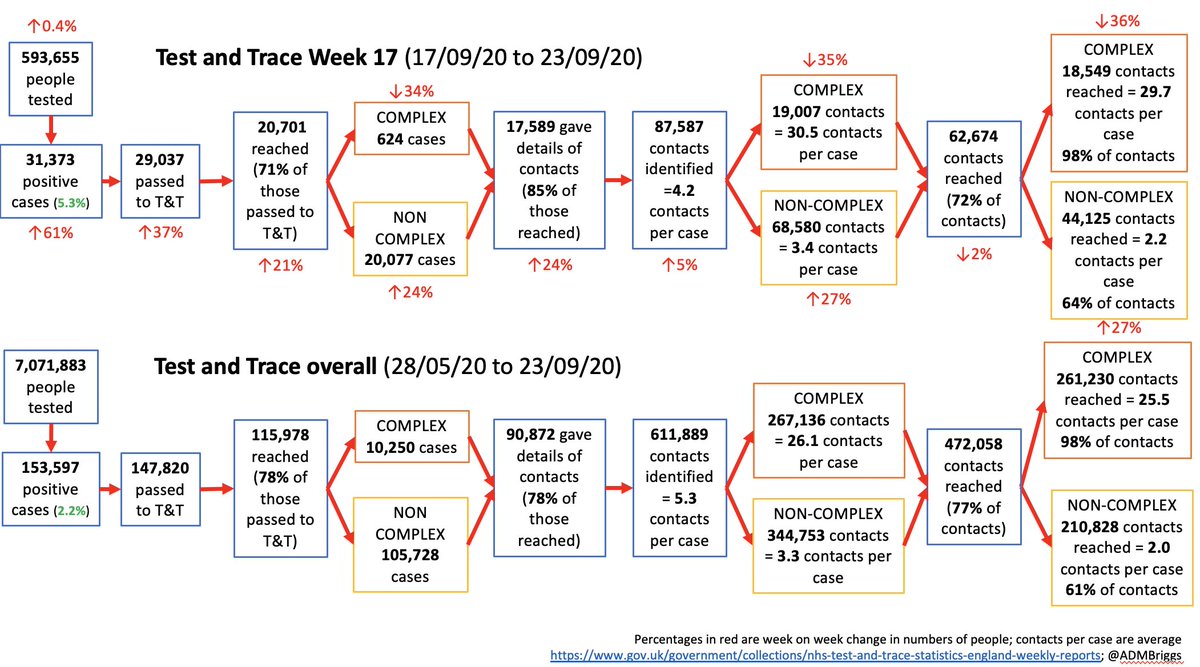
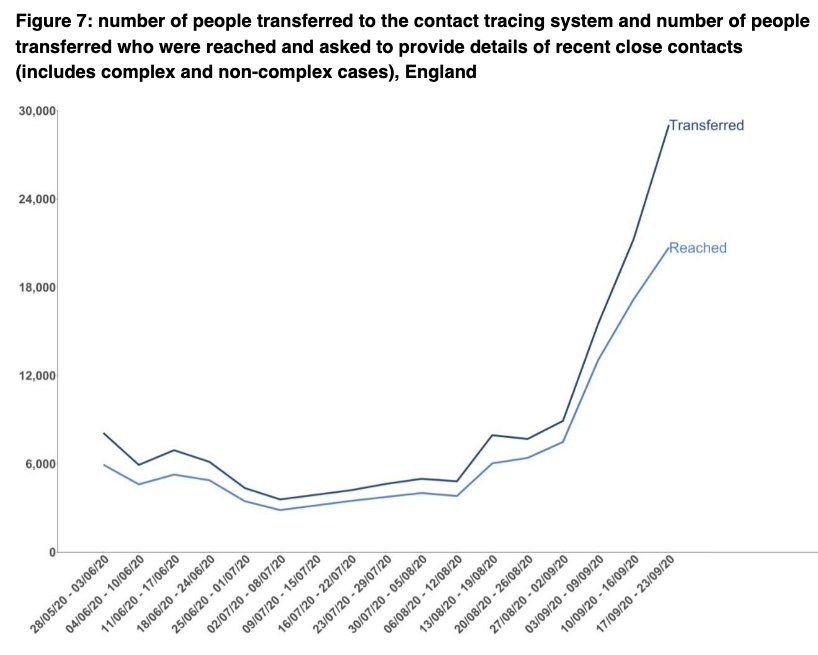
In terms of T&T performance, it’s not great.
First, of 29,037 cases transferred to the system, just 71% were reached compared to 80%+ for the preceding 4 weeks.
First, of 29,037 cases transferred to the system, just 71% were reached compared to 80%+ for the preceding 4 weeks.
And the geographical variation is worrying. Currently T&T don’t publish that as weekly data by UTLA, but plan to look into this in more detail with colleagues soon. It’s really important for understanding how T&T impacts local transmission, case rates, lockdowns.

(AGAIN @DHSCgovuk, *PLEASE* provide data on cases managed by local authority led contact tracing systems. These are being introduced across the country and we need to know their impact as well as potential barriers to further success)
Of cases reached, just 624 are complex (outbreaks, high risk settings) and 20,077 are non-complex.
Yet – 4,898 cases were pillar 1 - NHS and PHE labs (those in hospital, health and care workers). 🤔
Yet – 4,898 cases were pillar 1 - NHS and PHE labs (those in hospital, health and care workers). 🤔


This either means complex cases are harder to reach than non complex, which I think is unlikely.
OR the lines between who is being tested under pillar 1 and 2 are getting increasingly blurred as test capacity - esp P2 - is stretched.
OR the lines between who is being tested under pillar 1 and 2 are getting increasingly blurred as test capacity - esp P2 - is stretched.
More people again provided details of contacts. Now 84%. This is great.

Total number of contacts is up just 5% on last week to 87,587, compared to 24% increase in number of cases giving details of contacts.
This is because there are relatively more non-complex cases being reached compared to last week, and they have fewer contacts per case.
This is because there are relatively more non-complex cases being reached compared to last week, and they have fewer contacts per case.

Contacts per case for complex and non-complex are pretty much the same as past week at 30.5 and 3.4 contacts per case respectively.
The fall in the %age of total contacts reached to 71% (76% last week) is entirely explained by relatively more non-complex cases being managed.
The fall in the %age of total contacts reached to 71% (76% last week) is entirely explained by relatively more non-complex cases being managed.
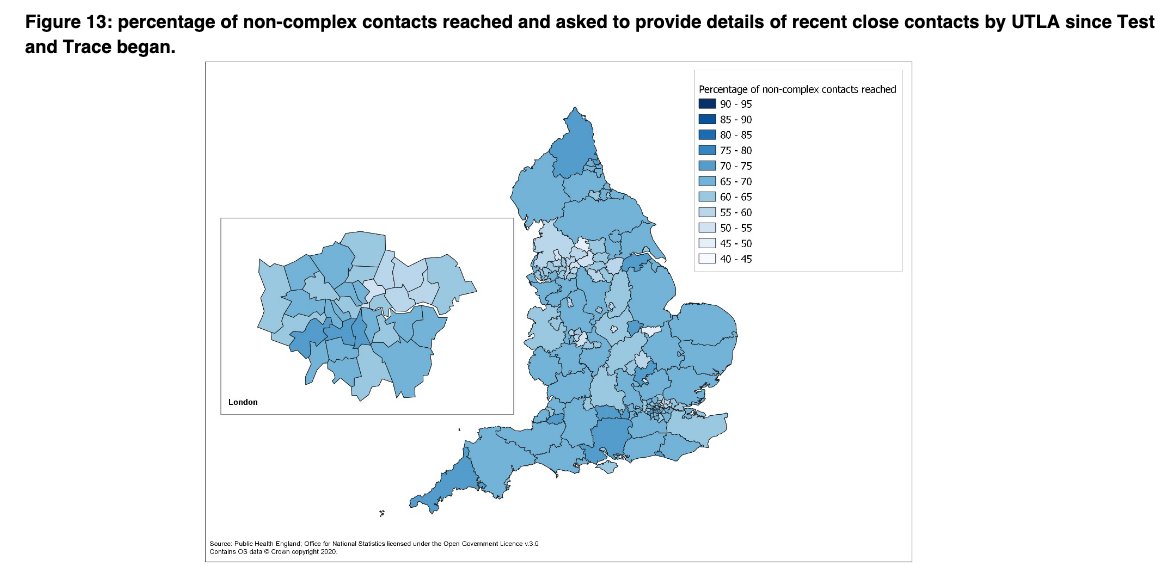
The percentage of contacts reached for complex and non-complex has stayed the same at 98% and 64% respectively.

BUT again look at the geographic variation. This difference (esp NW) is marked. What role does this play in the current high case rates there??
The test turnaround time is actually BETTER this week for pillar 2. This represents a real achievement after previous trends.
But there is potential first sign in a while of pillar 1 performance dropping - to watch closely as may represent their capacity maxing out.
But there is potential first sign in a while of pillar 1 performance dropping - to watch closely as may represent their capacity maxing out.


However, once a case is in T&T, significant drop in percentage of cases reached within 24hrs, as well as small drop in close contacts reached within 24hrs.


And finally, underlying all this "71% of cases reached ➡️85% give contact details ➡️72% of contacts reached" is the fact that current data suggest <20% of cases and just 11% of contacts isolate for the required time anyway.
https://twitter.com/ADMBriggs/status/1309222838080081921?s=20
So whilst T&T is part of what's needed to limit spread, it's clearly just one bit. We need clear communication, to trust the system, support when isolating.
And masks, distancing, and handwashing remain a far better way to control spread than isolating after diagnosis.
And masks, distancing, and handwashing remain a far better way to control spread than isolating after diagnosis.
Wk17 T&T⬆️ @felly500 @trishgreenhalgh @deb_cohen @martinmckee @carolecadwalla @mgtmccartney @ADPHUK @Jeanelleuk @fascinatorfun @profchrisham @petermbenglish @HPIAndyCowper @Davewwest @HSJEditor @KateAlvanley
@IndependentSage @nedwards_1 @chrischirp @SamanthaJonesUK @ewanbirney
@IndependentSage @nedwards_1 @chrischirp @SamanthaJonesUK @ewanbirney
@TimHarford @devisridhar @FurberA @andrewleedr @Dr_D_Robertson
Tagging a few additional people who may be interested. Do say if not the case.
Tagging a few additional people who may be interested. Do say if not the case.
And also linking in our explainer on T&T in case it's useful for those who haven't yet seen
health.org.uk/publications/l…
health.org.uk/publications/l…
• • •
Missing some Tweet in this thread? You can try to
force a refresh