Ed Conway Profile picture
Oct 2, 2020 12 tweets 8 min read Read on X
Belatedly catching up with Test & Trace data from yday. Good news is on most metrics the performance of Pillar 2 tests (the private bit of the testing network) have improved from the previous week.
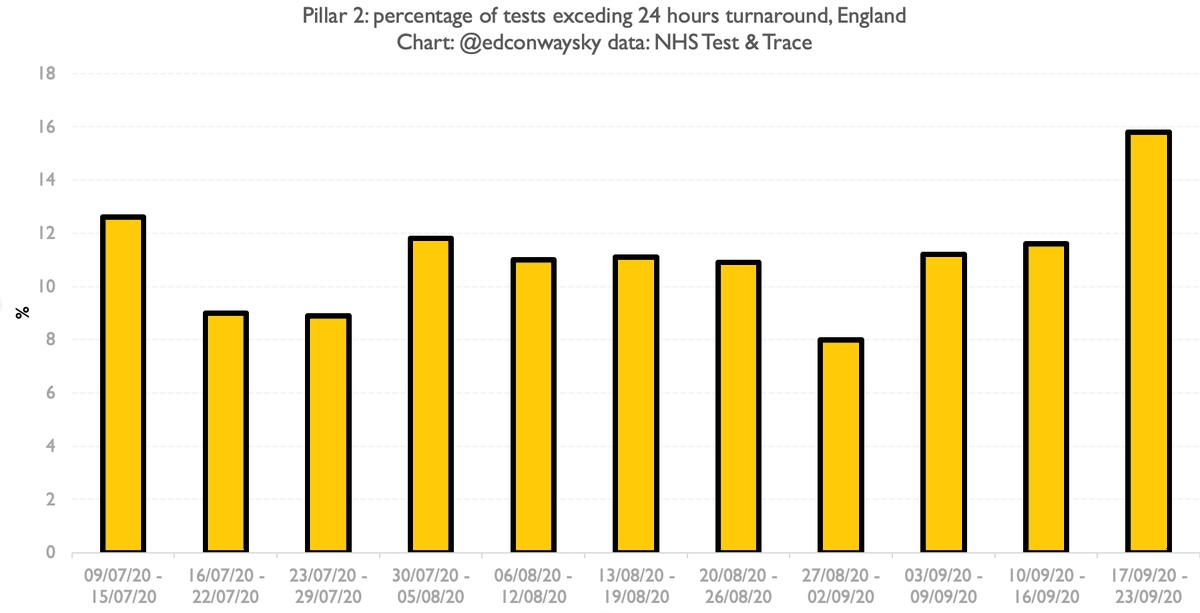
⬇️Time taken to get a test result
⬇️Distance travelled to get a test
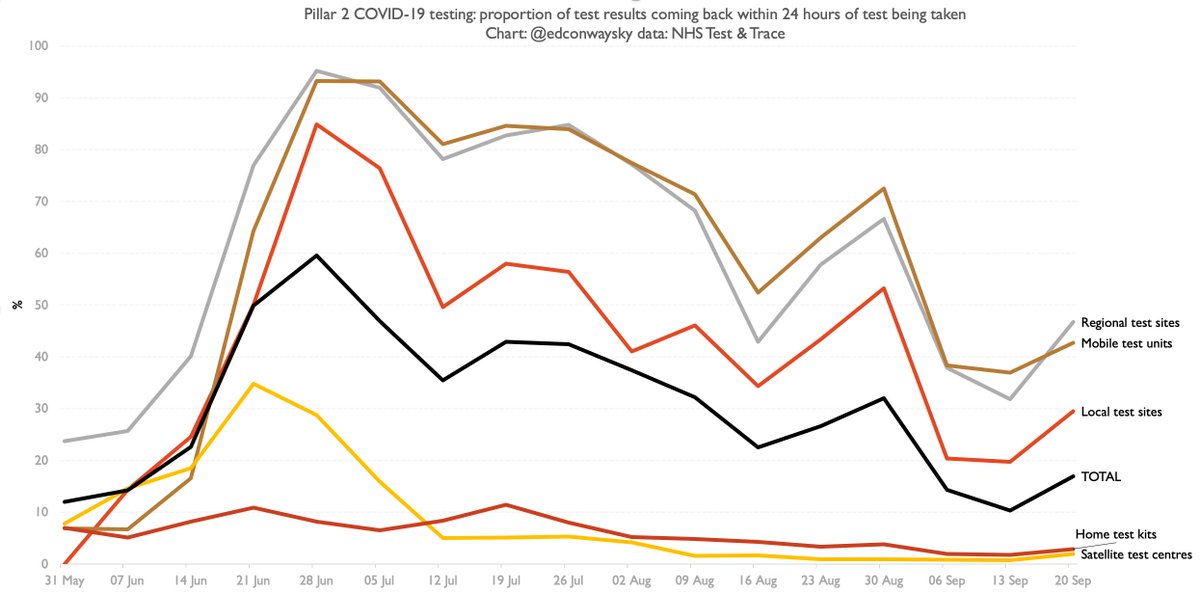
That said, across the whole of pillar 2 in England the percentage of people getting test results within 24 hours of taking a test is still just 17% as of 17-23 Sep (eg last week). That's still a lot lower than earlier this summer as you can see from this chart:
Actually when it comes to test turnaround the one area where test processing/delivery seems to be slowing down is pillar 1, which is primarily hospital labs - the bit of the system that had held up best thus far
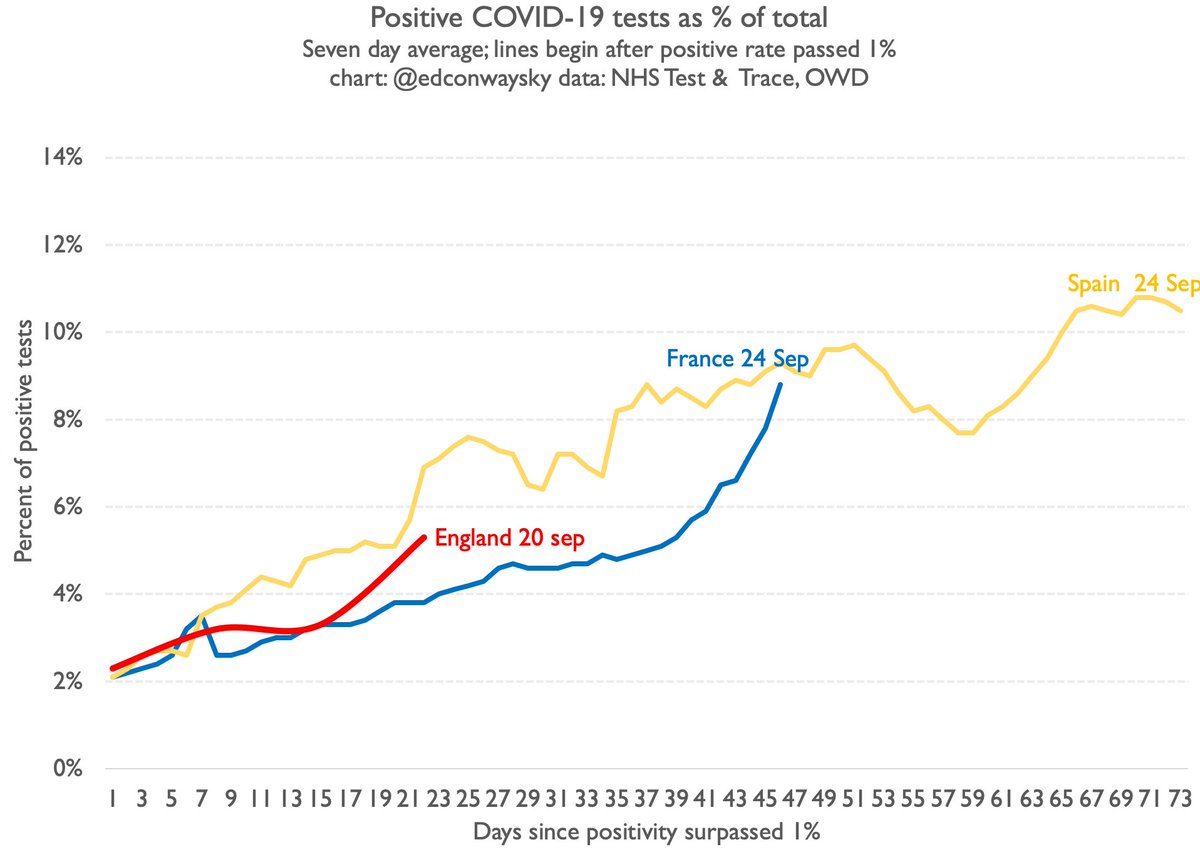
The Test & Trace stats also provide us with a more reliable measure of the percentage of positive #COVID19 tests. A useful sense check of the case data we get each day. Consistent with UK continuing to follow French/Spanish trajectory. Let's also see what @ONS data says shortly
Breaking: @ONS survey of #COVID19 infections in England has been released.
This is the best measure we have of the prevalence of the disease.
And the good news is it seems the growth rate has slowed since last week.
Ties in with what we're seeing elsewhere in the case numbers
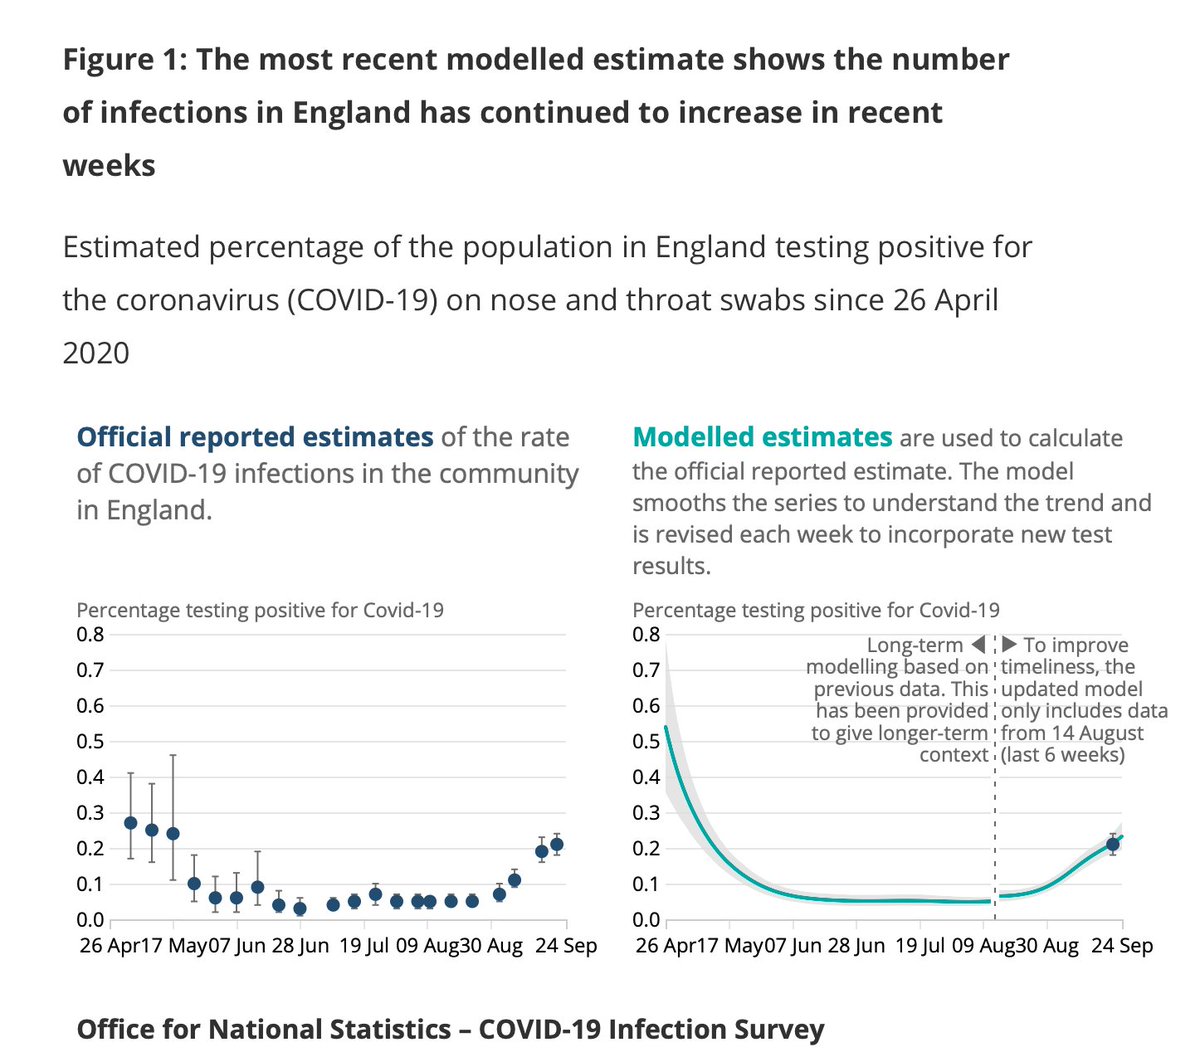
Important to provisos about the @ONS survey.
It's based on modelling; it can change a lot from week to week.
Even so, the picture painted by today's survey is tentatively reassuring.
The disease is still spreading.
But the rate at which cases are multiplying seems to be slowing
Poss the most reassuring #COVID19 chart in months.
This is @ONS’s measure of daily new #COVID19 cases in England - the best measure of its spread, unaffected by testing shortages.
Look: it’s still spreading but the growth rate has flattened.
Early days, but this is promising…
Few reasons to remain cautious despite slowing in @ONS new cases rate:
1. Data can be choppy from week to week
2. #COVID19 still growing; NB we’re talking about the RATE of growth.
3. On basis of what we’re seeing in France/Spain actually getting new cases to FALL takes time…
Finally, it’s clear from the @ONS survey as well as plenty of other sources (eg @PHE_uk data today) that there are hotspots of the disease where, unlike the national picture, it is still spreading.
This is a dangerous disease.
No cause for complacency.
Keep focusing on the data.
Update: 6,968 new #COVID19 cases in UK in past 24 hours, acc to Gov.uk dashboard.
UK case trajectory remains in line with France/Spain.
Rising - but at a slower rate than previous weeks.
Doubling time for cases currently about 30 days on basis of past week
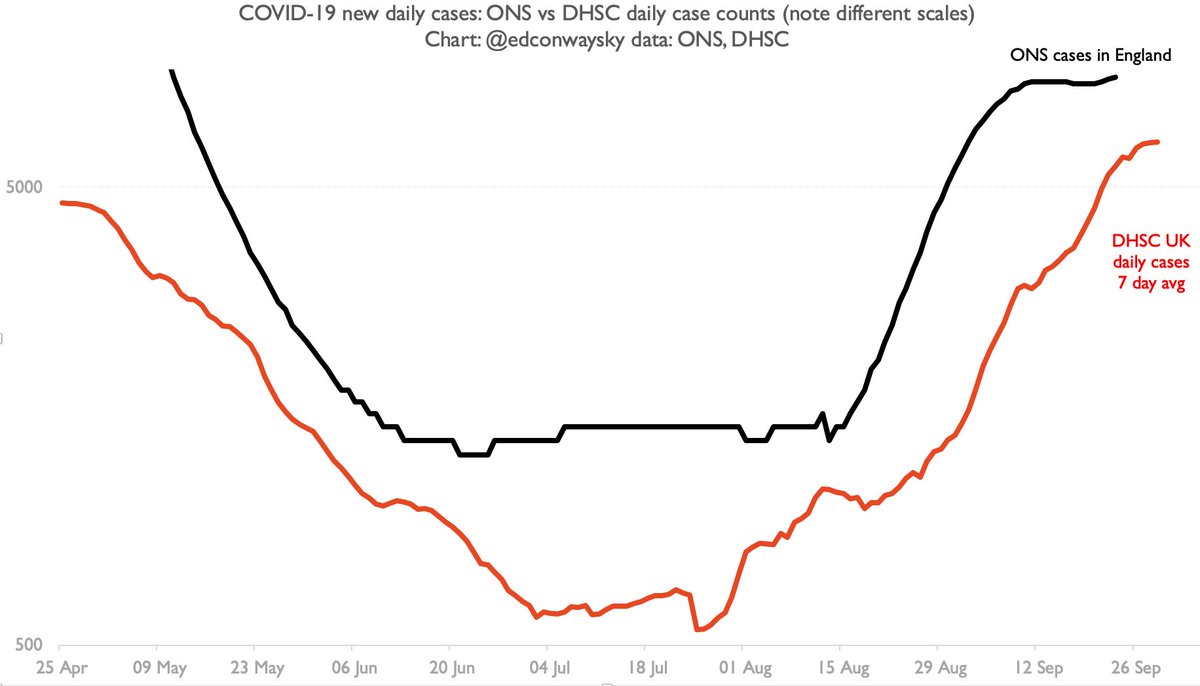
Some people have asked me whether the daily #COVID19 case figs are reliable. Aren’t they distorted by test availability? Here’s one way of gauging that - comparing them (the red line) to the v reliable @ONS survey (black). Key thing is shape - if it’s similar that’s a good sign.
Key thing in this chart is not the difference in levels but the relative similarity in steepness of the recent rise.
The growth in cases we’ve been hearing abt each day isn’t that different from the @ONS one.
Yes that’s a log scale.
Yes it’s England vs UK.
This is a sense check.
• • •

Missing some Tweet in this thread? You can try to force a refresh
 

Keep Current with Ed Conway

Ed Conway Profile picture

Stay in touch and get notified when new unrolls are available from this author!

Read all threads

This Thread may be Removed Anytime!

PDF

Twitter may remove this content at anytime! Save it as PDF for later use!

Try unrolling a thread yourself!

how to unroll video
  1. Follow @ThreadReaderApp to mention us!

  2. From a Twitter thread mention us with a keyword "unroll"
@threadreaderapp unroll

Practice here first or read more on our help page!

More from @EdConwaySky

Mar 18
NEW
Britain's motoring lobby group the @SMMT has insisted that an unprecedented 2,000% increase in car exports to Azerbaijan has NOTHING to with Russia and is explained by the fact that this former Soviet state is a “flourishing market in its own right”.
This is rather... odd
🧵 Image
Before we get onto that, some background (thread on this here👇).
TLDR: UK car exports to Russia have collapsed, because of sanctions. But UK car exports to countries neighbouring Russia have suddenly risen by nearly the same amount. Esp Azerbaijan
Following my original report we now have new figs on UK car exports.
They show flows to Azerbaijan have continued. £42m in Jan. 3rd highest EVER.
Now there's no way of being 100% sure what's going on here. you can't track consignments beyond Azerbaijan (if they ever reach Az) Image
Read 13 tweets
Mar 12
🚨The strange tale of British luxury cars & Russian sanctions🚨
🧵A thread on some v striking charts which raise some disturbing questions abt the car industry.
Let's start at the start.
Wealthy Russians love high-end British cars.
Don't just take it from me. Take it from her 👇
So when Russia invaded Ukraine, it was not without significance that all Britain's major carmakers said they would stop sending their cars to Russia.
Anyway, shortly afterwards, the UK imposed sanctions which made it illegal to do so anyway...
There are two sanctions of note here.
First, UK companies cannot send "dual use" items to Russia which could be turned into weapons.
Second, there was a specific ban on the sale of any car over £42k👇
So it's pretty simple. No cars. Esp not luxury cars. legislation.gov.uk/uksi/2022/452/…
Image
Read 15 tweets
Mar 6
💷BUDGET THREAD💷
A few thoughts on what was supposed to be a big event but ended up feeling, well, a wee bit thin.
And that’s the first thing to say.
Strikingly, this Budget was HALF as big as the Autumn Statement. Look at the difference between the scorecard totals 👇
Image
Image
Was it a tax-cutting Budget?
I mean… not really.
Well, OK, the net impact is taxes aren’t going up as quickly as they were 6 months ago.
But (and I think this is pretty crucial) THEY’RE STILL GOING UP. The tax burden will be higher at the end of this Parliament than before.
Here’s a good illustration of that.
The bars here show you the impact, across the economy, of the decision a few Budgets ago to freeze tax allowances. The bars are in negative territory.
People are paying more in taxes as they get dragged into higher thresholds… Image
Read 14 tweets
Feb 23
🧵Here's a thread about an obscure economic theory from a century and a half ago, which is about to become a MASSIVE deal.
⚡️It helps explains why tackling climate change is going to be v v hard. Some say impossible.
The story begins with this building👇
Yes it's the @SphereVegas.
Not just a massive entertainment venue but also the world's biggest screen. By all accounts it's an amazing spectacle both outside and in, where there's also a ginormous wraparound LED screen (also one of the biggest anywhere)
Get up close to that enormous exterior screen & it looks v different.
You see an array of little glowing pucks, each one decked with 48 light emitting diodes (LEDs). These act as the "pixels" of the image you see from miles around. These things are magic businessinsider.com/what-the-las-v…
Image
Read 32 tweets
Feb 21
🚨How British companies are bolstering Vladimir Putin’s war machine🚨
A depressing thread.
But an important one.
With some pretty shocking charts.
Let’s begin with the “official” picture. It suggests UK trade with Russia has collapsed since Feb 2022. Down by 74%… Image
Now let's fill in the data.
Look how we're no longer exporting cars or heavy machinery to Russia. Because the govt is well aware this stuff could be repurposed into weapons. So the official line is that this is a big success story.
Looks like Russia's economy is being starved Image
But clearly the Russian economy isn't doing as badly as all that. Indeed Russia is due to grow faster than any G7 nation this year 👇
And that's just the economy. Now look at the battlefield and Russia is looking v strong. No shortage of weapons/drones etc despite sanctions
Why? Image
Read 17 tweets
Jan 20
With Tata steel having just confirmed the closure of the two blast furnaces at Port Talbot, here are a few important datapoints.
First, UK steelmaking has collapsed faster, over the past half century, than ANY other country in the world save for Venezuela.
Pretty shocking👇 Image
The Tata plan is to replace the two blast furnaces with two electric arc furnaces.
There are some strong arguments - not all of which come back to net zero.
One is that Britain produces more than enough scrap steel to satisfy its needs. At the moment this is mostly exported Image
Electric arc furnaces exist to RECYCLE steel via a massive electric current.
UK has long been an outlier in having v few of them. Look: less, proportionally, than nearly any other country in the world.
Essentially we stuck with blast furnaces far longer than most other nations... Image
Read 10 tweets

Did Thread Reader help you today?

Support us! We are indie developers!


This site is made by just two indie developers on a laptop doing marketing, support and development! Read more about the story.

Become a Premium Member ($3/month or $30/year) and get exclusive features!

Become Premium

Don't want to be a Premium member but still want to support us?

Make a small donation by buying us coffee ($5) or help with server cost ($10)

Donate via Paypal

Or Donate anonymously using crypto!

Ethereum

0xfe58350B80634f60Fa6Dc149a72b4DFbc17D341E copy

Bitcoin

3ATGMxNzCUFzxpMCHL5sWSt4DVtS8UqXpi copy

Thank you for your support!

Follow Us!

:(