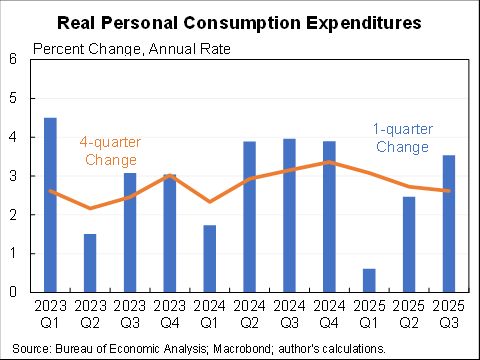
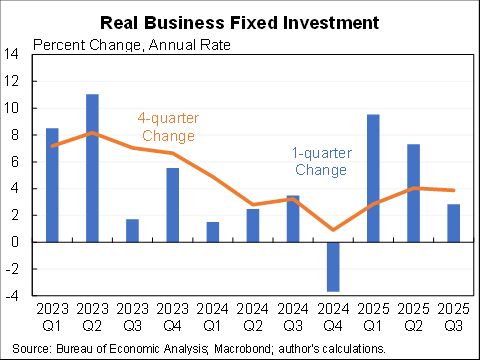
We have an economy with a positive first derivative and negative second derivative—everything is continuing to improve but it improving at a slower pace than before.
Normally 661,000 jobs would be something to celebrate. But when you’re 11 million jobs short of where you were in February the slowing pace of recovery is a worry.
Three reasons for it:
1. Easy recovery already happened. Has been people being called back from temporary layoff, permanent unemployment rising.
2. CARES Act expired.
3. Virus resurgence.
Notably in September there were 661,000 jobs added (payroll survey) while 1.5m reduction in temporary layoff (household survey). That is worrying because the fuel of labor market recovery is going away.
Also notable, the labor force participation rate has not moved since July. Normally we would expect a strengthening economy to have an increase in participation rates. Moreover, if the $600 was having a large disincentive effect that should have raised participation.
• • •
Missing some Tweet in this thread? You can try to
force a refresh
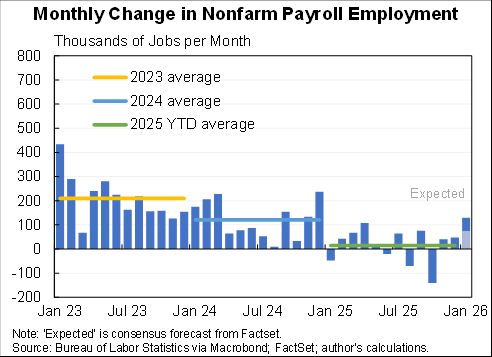
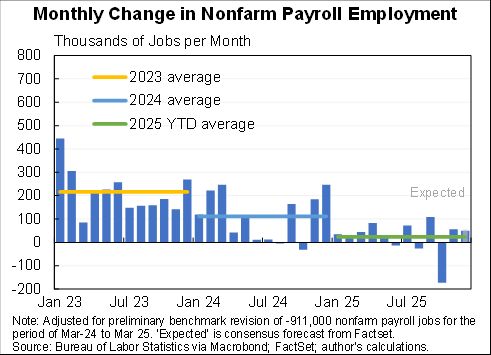
Strong jobs report. 177K jobs added. Unemployment rate steady at 4.2% but participation rate up and U-6 down. Hours steady. A slowdown in hourly wage growth.
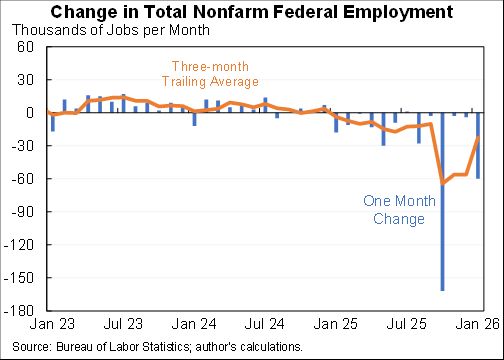
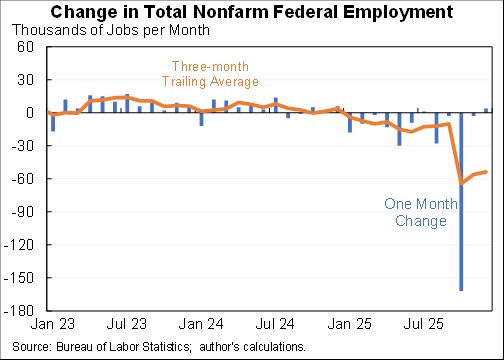
Federal employment was down a bit but state and local more than made up for it. The trend in private jobs is basically the same as total.
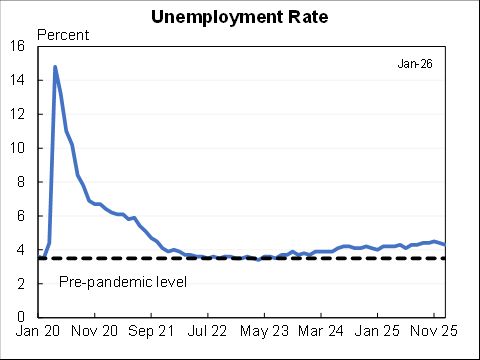
Unemployment rate very slowly drifted up for the last year and a half.
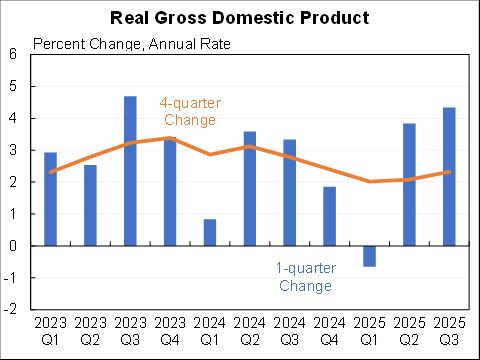
Wednesday's Q1 GDP # will have a lot of economic noise, a lot of measurement noise, and could generate even more political noise.
A technical🧵on one aspect: what period does it reflect?
The answer is a combo of pre- and post- 1/20 because of the weirdness of quarterly averages
When I (and most people) look at things like CPI or jobs, we look at something like a three month average. That would be growth from Dec 2024 to Mar 2025. Which is also the (geometric) average of the growth rates in Jan, Feb and Mar. It tells you what happened in those 3 months.
But GDP is not reported monthly (fortunately, would be really volatile). So the numbers are the growth from the average of Oct/Nov/Dec to Jan/Feb/Mar. If there is weak growth in Nov or Dec that lowers part of Q4 but all of Q1 so lowers overall growth.
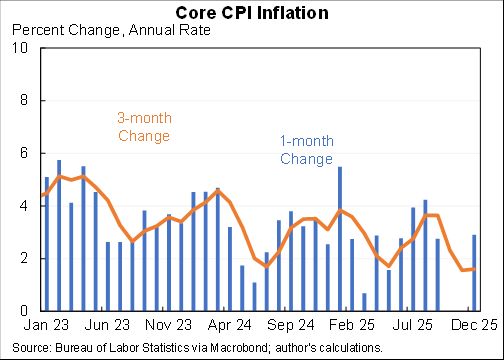
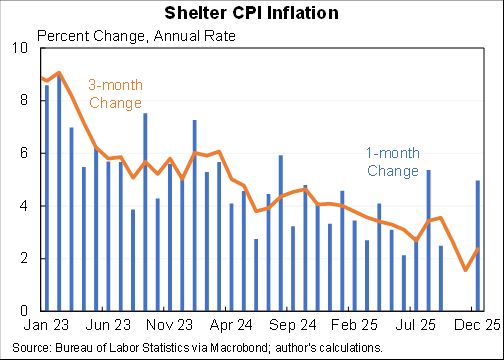
Core PCE inflation came in a little above the already high expectations in Feb. The pattern is the opposite of what you want to see--the shorter the window the higher the annualized rate (and still high at 12 months):
Here are the full set of numbers. They were uniformly ugly in February.
If you're looking for some slivers of reassurance, market-based core (which excludes imputed items like portfolio fees) was only up 2.4% over the last 12 months. And "only" 3.0% annualized over the last three, less than the regular core.
Income taxes are distort trade by reducing purchases of imports. At least they do so as much as VATs do. Which is to say not any more than they reduce purchases of domestic goods.
A hopefully irrelevant thread.
A simple toy example.
Consider a person in Spain with 100€ in income that they use to buy oranges. Absent taxes oranges cost 1€. They must spend all their income this year.
In this case they could buy 100 total oranges--imported plus Spanish.
Now assume there's a 25% VAT.
VAT raises the cost of imported oranges to 1.25€, this is the way it is supposed to be like a tariff.
Of course, also raises the cost of Spanish oranges to 1.25€. This is not a tariff & is trade neutral.