Too many are "misreading" the polls, betting markets and investor opinion around the election. They are not the same.
Please read this short thread ….
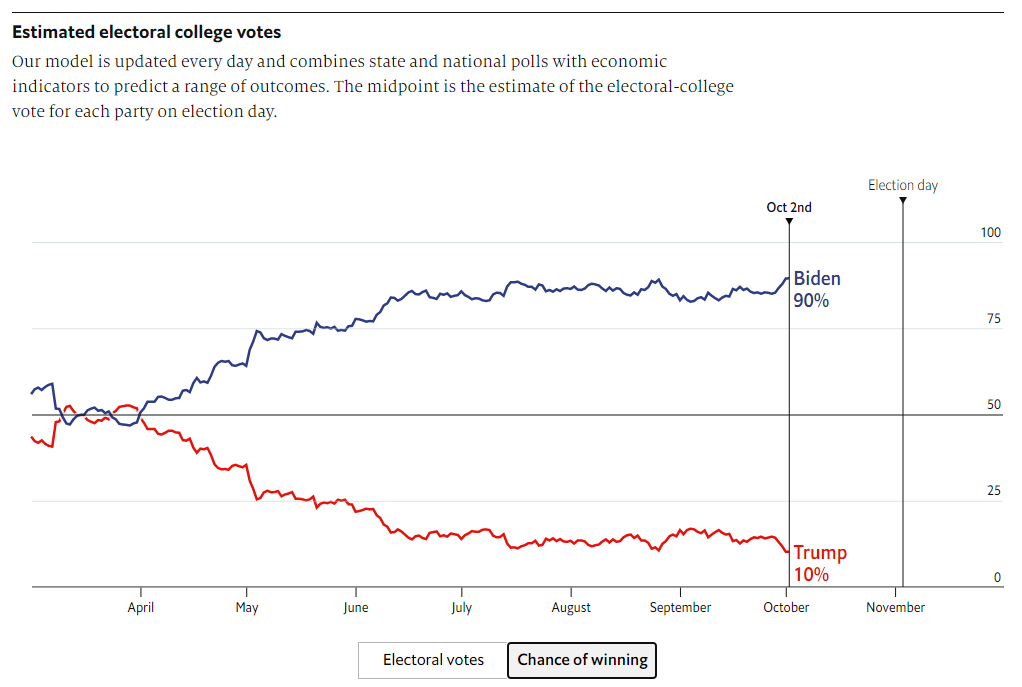
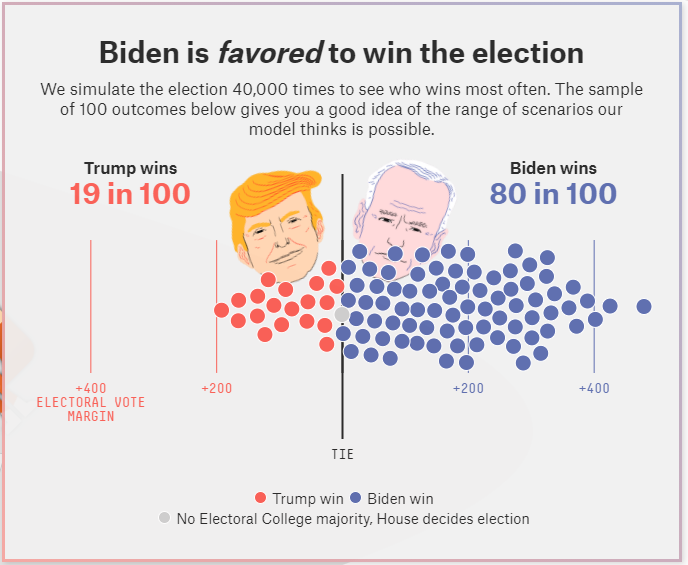
The poll analyzers were only giving Trump a 10% to 20% chance of winning (shown are FiveThirtyEight and the Economist)
(1/5)
Please read this short thread ….
The poll analyzers were only giving Trump a 10% to 20% chance of winning (shown are FiveThirtyEight and the Economist)
(1/5)
Betting markets gave Trump a 42% chance of winning yesterday before the announcement of the positive COVID test. His odds were 47% before Tuesday’s debate. Now they give Trump a 39% chance. This marks Biden’s largest lead.
(2/5)
(2/5)

Investors were more aligned with the betting markets than the polls.
FT – (Sep 25) Investors anticipate Joe Biden election win
UK pollster Survation found that 60 percent of 91 investment professionals polled in Sep, most based in the US, believe Mr Biden will win
(3/5)
FT – (Sep 25) Investors anticipate Joe Biden election win
UK pollster Survation found that 60 percent of 91 investment professionals polled in Sep, most based in the US, believe Mr Biden will win
(3/5)

The difference between polls and bettors was going to be reconciled by election day. Today’s announcement that Trump tested positive for COVID only accelerates the process.
Betting markets are reducing Trump’s odds of victory and are aligning more closely with the polls.
(4/5)
Betting markets are reducing Trump’s odds of victory and are aligning more closely with the polls.
(4/5)
We have contended the markets never fully priced in a Biden victory (and the increased regulation and higher taxes that come with it). Based on trading this morning, it appears they are now taking the prospect of a Biden presidency more seriously.
(5/5)
(5/5)
• • •
Missing some Tweet in this thread? You can try to
force a refresh