
Adding fossil CO2 to Earth's system affects carbon sinks (increased uptake), biosphere (eg soil degradation, plant growth), and oceans (acidification).
But how are they affected when CO2 is removed from the system, as IPCC models see us do increasingly from 2020 onwards?
But how are they affected when CO2 is removed from the system, as IPCC models see us do increasingly from 2020 onwards?
Like adding CO2 to the system meant, some ends up in the atmosphere and some goes into carbon sinks, circles between the sinks, and has feedbacks, eg wildfires,
so will active CO2 removal, CDR, somehow divide the "loss" of atmospheric CO2 between sinks. And have feedbacks, too.
so will active CO2 removal, CDR, somehow divide the "loss" of atmospheric CO2 between sinks. And have feedbacks, too.
iopscience.iop.org/article/10.108…
Is a model study on the attainability of the 2°C target. "Also, this study is the first to present a detailed analysis of the global and regional carbon cycle response to various amounts of net negative emissions."
Good primer on the mechanisms at play?
Is a model study on the attainability of the 2°C target. "Also, this study is the first to present a detailed analysis of the global and regional carbon cycle response to various amounts of net negative emissions."
Good primer on the mechanisms at play?

I have 2 more papers on my reading list on the topic of CDR or NET, negative emission technology.
1) link.springer.com/article/10.100…
It's a 2018 literature overview on the current research of the effects of various ways of carbon removal on biosphere, oceans and their carbon sinks.
1) link.springer.com/article/10.100…
It's a 2018 literature overview on the current research of the effects of various ways of carbon removal on biosphere, oceans and their carbon sinks.
2) iopscience.iop.org/article/10.108…
Explores the effects of CDR in the "lower concentration pathway", RCP2.6 (ie max +2˚C), in 21st and 22nd century.
"Earth system models suggest significant weakening, even potential reversal, of ocean and land sinks under future low emission scenarios."
Explores the effects of CDR in the "lower concentration pathway", RCP2.6 (ie max +2˚C), in 21st and 22nd century.
"Earth system models suggest significant weakening, even potential reversal, of ocean and land sinks under future low emission scenarios."

But today, Katarzyna B Tokarska and Kirsten Zickfeld will be my/our teachers especially on the mechanisms at play.
The study outline is to explore/model scenarios with gradual positive fossil CO2 emission reduction down to 0, followed by technologically feasible rates of CDR.
The study outline is to explore/model scenarios with gradual positive fossil CO2 emission reduction down to 0, followed by technologically feasible rates of CDR.
Once we stop adding fossil CO2 and are actively removing it from the atmosphere, mean˚C over land "responds promptly".
☝️But GLOBAL˚C over centuries is determined by a slow heat release from the oceans. ☝️
Which stored a LOT!
☝️But GLOBAL˚C over centuries is determined by a slow heat release from the oceans. ☝️
Which stored a LOT!
https://twitter.com/anlomedad/status/1312490099339218946from agupubs.onlinelibrary.wiley.com/doi/full/10.10…

The paper explores CDR's effects on carbon sinks in scenarios which aim to lower global mean temperature to 2˚C.
(Note: while not compatible to "WELL below 2˚", the internationally agreed target, it's a trajectory we're on at the moment, nonetheless. But we change that! 💪💫)
(Note: while not compatible to "WELL below 2˚", the internationally agreed target, it's a trajectory we're on at the moment, nonetheless. But we change that! 💪💫)

Here's the method description.
Note, why emission scenarios r restricted to 4-6%gradual reductions: because more is considered "extreme" in the literature.
(WHO set THAT boundary, I ask? And "extreme", compared to what? Extreme, to me, is the outcome of too gradual reduction.)
Note, why emission scenarios r restricted to 4-6%gradual reductions: because more is considered "extreme" in the literature.
(WHO set THAT boundary, I ask? And "extreme", compared to what? Extreme, to me, is the outcome of too gradual reduction.)
The paragraph also says that the paper explores removal of up to 550GtC. Because, and I find that worth noting,
geological storage capacity is estimated to be between 550GtC and 1900 GtC.
(1GtC corresponds to 3.67Gt CO2, a little less than EU's annual CO2 emission)
geological storage capacity is estimated to be between 550GtC and 1900 GtC.
(1GtC corresponds to 3.67Gt CO2, a little less than EU's annual CO2 emission)
The paper's scope of gradual carbon removal of 550GtC then means ~ 2000Gt CO2.
Cumulative emissions up to 2017 were 1580Gt, leaving 420Gt... ourworldindata.org/grapher/cumula…
So, they look at removal of all CO2 of a IPCC SR15 1.5˚range.
But it's removal over the course of centuries!
Cumulative emissions up to 2017 were 1580Gt, leaving 420Gt... ourworldindata.org/grapher/cumula…
So, they look at removal of all CO2 of a IPCC SR15 1.5˚range.
But it's removal over the course of centuries!


The paper also includes a scenario of 680GtC removal, which, acc to them, means removal of all anthropogenic/fossil CO2 = 2500Gt.
Note: removal over the course of centuries during which mankind actively works in a cooperative, coordinated manner.
Note: removal over the course of centuries during which mankind actively works in a cooperative, coordinated manner.
Further parameters are annual rate of removal: maximum rate of 6 GtC/a, or 22Gt CO2. And 13.8 GtC or 50Gt CO2 "in the additional scenarios with extreme negative cumulative emissions."
[Note the word "extreme" again? So OUR reduction shall NOT be extreme >6%/yr☝️but removal can.]
[Note the word "extreme" again? So OUR reduction shall NOT be extreme >6%/yr☝️but removal can.]

(My criticism of "extreme" is not directed at the authors. But at the ones who came up with that 6% boundary, clearly having in mind a slow, comfy transition, with ++economic growth...They ruled out, and with zero! scientific reason, what UK did 1939-56:
https://twitter.com/anlomedad/status/1298137352091701248)
They designed 2 sets of emission scenarios from the years 2001-3000. Removal in both scenarios starts in the year 2100, the assumed year of zero fossil CO2 emissions.
CCE: positive emissions of 550GtC, removal max 305GtC
VCE: positive emissions of 200-700GtC, removal max 460Gt
CCE: positive emissions of 550GtC, removal max 305GtC
VCE: positive emissions of 200-700GtC, removal max 460Gt


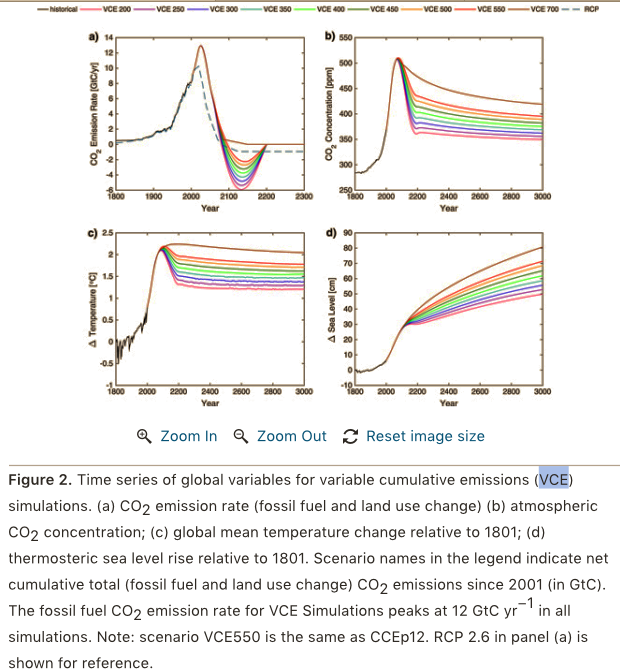
The graphs show the outcome of the various scenario runs in 1) CCE scenarios (stands for Constant Cumulative Emissions) and 2) VCE (Variable Cumulative Emissions)
How various pathways of emission rate in GtC/yr correspond to ppm,˚C and sea level rise.
Let's look at it in detail
How various pathways of emission rate in GtC/yr correspond to ppm,˚C and sea level rise.
Let's look at it in detail


CCE: note time scales differ on x-axis.
Emissions from fossil fuel and landuse change peak in ~ 2030;
🟢at 10GtC/yr, 🔵a bit later at 15GtC/yr (55Gt CO2)
Negative emissions begin 2100, peak in 2150 at -5GtC (-18Gt CO2).
(Note: today's carbonsink uptake is also 5GtC, 18Gt CO2)
Emissions from fossil fuel and landuse change peak in ~ 2030;
🟢at 10GtC/yr, 🔵a bit later at 15GtC/yr (55Gt CO2)
Negative emissions begin 2100, peak in 2150 at -5GtC (-18Gt CO2).
(Note: today's carbonsink uptake is also 5GtC, 18Gt CO2)

CO2 ppm peaks in 2070 / 2080 from 🟢460 to 🔵550ppm; then ppm steeply declines to 440ppm by year ~2190 and reaches 390ppm in the year 3000.
CCE's outcome on global mean˚C and sea level rise.
🟢peaks pre 2100 at ~2˚C,
🔵peaks at 2.5˚C in 2100.
By 2200, all scenarios show to be slightly below 2˚C. (Note: not Paris compatible)
Sea level rise ranges from 🟢20cm to 30cm 🔵in 2100 and inevitably (!) 70cm by year 3000.
🟢peaks pre 2100 at ~2˚C,
🔵peaks at 2.5˚C in 2100.
By 2200, all scenarios show to be slightly below 2˚C. (Note: not Paris compatible)
Sea level rise ranges from 🟢20cm to 30cm 🔵in 2100 and inevitably (!) 70cm by year 3000.

VCE: all scenarios peak at 13GtC/yr in emissions and 510ppm by 2030 and decline at the same rate until CO2 zero in 2100.
Correspondingly,˚C peaks lower in 2100 at about 2.2˚C.
But then, all trajectories differ after 2100 due to negative emissions from none in🟧 to -6GtC in rosé
Correspondingly,˚C peaks lower in 2100 at about 2.2˚C.
But then, all trajectories differ after 2100 due to negative emissions from none in🟧 to -6GtC in rosé

If you look closely at the shapes of CCE and VCE, it is clear that apart from the attained CO2 concentration in ppm, both, the reduction speed or rate AND the rate of negative emissions, determine the outcome on temperature by 2100 and beyond - and that of sea level rise, too!
Whatever mechanisms are at play, there, they are also at play, today. Reduction speed determines how the temperature rise develops. Today! It matters how fast we are, now. It matters to the warming rate, if we go the path some call "extreme" because it surpasses THEIR 6%-boundary
(In practice, we can combine CCE and VCE activities.
And be faster, I'm certain.)
A real bonus of the paper is chapter "3.1. Physical climate system response". It explains the mechanisms further which lead to such hugely different outcomes.
And be faster, I'm certain.)
A real bonus of the paper is chapter "3.1. Physical climate system response". It explains the mechanisms further which lead to such hugely different outcomes.
Are you ready? I need a rest first😁
I'll be back in a few hrs to read the rest of the paper.
A question: do you find my personal opinion comments (eg. "extreme") superfluous/disturbing/wrong?
I do like to state my opinion on what I read, you know. Makes the odd stuff be noted.
I'll be back in a few hrs to read the rest of the paper.
A question: do you find my personal opinion comments (eg. "extreme") superfluous/disturbing/wrong?
I do like to state my opinion on what I read, you know. Makes the odd stuff be noted.
Before I go (and come back): just had a major realisation. My dream, natural carbon sinks reduce CO2 ppm is wrong. Because natural carbon sinks aren't a permanent solution! Our added fossil CO2 stays IN the system and feedbacks like fires add it back to the atmosphere.
Bummer.
Bummer.
Which finally explains why BECCS is so attractive: burning biomass [to harvest energy] AND capture and store that plant CO2 before it's emitted to the atmosphere💡Land use and mono cultures for BECCS compete with renaturalisation and food. So let's go near-vegan and free up land.
Part 2 of reading iopscience.iop.org/article/10.108…. Scroll up if you missed Part 1.
Chapter 3.1. Physical climate system response, begins with describing the modelled outcomes like what I did above, but adds the focus on how the 2 scenario runs, CCE and VCE, affect sea level rise.
Chapter 3.1. Physical climate system response, begins with describing the modelled outcomes like what I did above, but adds the focus on how the 2 scenario runs, CCE and VCE, affect sea level rise.

The study expressly omits sea level rise from melting ice caps and looks only at thermal expansion and contraction via ocean heat uptake.
Oops. Remember: CCE models show a rise of 70cm by the year 3000; VCE from 50cm to 80cm – and that's both only thermosteric sea level rise.
Oops. Remember: CCE models show a rise of 70cm by the year 3000; VCE from 50cm to 80cm – and that's both only thermosteric sea level rise.


The authors find that thermosteric rise during the negative emission phase between 2100 & 2200 slows for CCE models, following a short decline of global mean temperature to 2˚. But once temperature decline ~ stops in the "no emission phase" after 2200, thermosteric rise picks up.
VCE models, ie Various Cumulative Emissions, show a steeper reduction in ppm and temperature in the negative emission phase up to 2200, but sea level rise continues, as well, albeit much slower in scenarios with higher CO2 removal.
"Thus, our findings suggest that reversal and stabilization of sea level on centennial timescales requires amounts of negative emissions beyond what is currently deemed to be technologically feasible. "

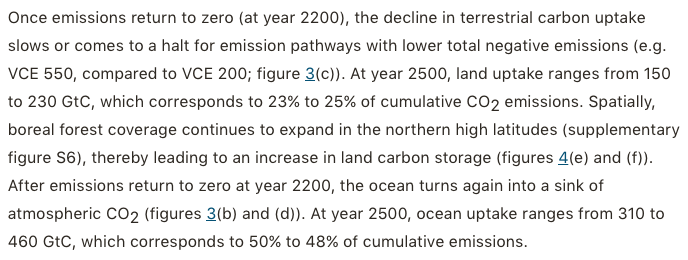
Now to the carbon cycle response land / ocean in
2 VCE models (they peak at 510ppm in 2100 and then various negative emissions to year 2200):
2 VCE models (they peak at 510ppm in 2100 and then various negative emissions to year 2200):
In the positive emission phase, land and ocean CO2 POOL grows🟦.
In the neg. emissions phase, all land and ocean carbon pools get smaller🟧, smaller still for higher CO2 removal scenario.
After that, during "no emissions", land pool stays neutral and ocean pool grows.
In the neg. emissions phase, all land and ocean carbon pools get smaller🟧, smaller still for higher CO2 removal scenario.
After that, during "no emissions", land pool stays neutral and ocean pool grows.

In the positive emission phase, land and ocean CO2 flux grows, blue indicates uptake🟦.
During neg. CO2, land and ocean show CO2 outgassing🟫, more outgassing for higher CO2 removal scenarios.
After that, during "no emissions", land uptake stays neutral and ocean uptake grows
During neg. CO2, land and ocean show CO2 outgassing🟫, more outgassing for higher CO2 removal scenarios.
After that, during "no emissions", land uptake stays neutral and ocean uptake grows

Until 2100, CO2 uptake on land from fertilisation is higher than the soil's GHG respiration rate from rising˚C.
During negative CO2 until 2200, land and ocean outgas. On land, due to falling˚C in this phase, soils outgas less but plants grow less due to less fertilisation.
During negative CO2 until 2200, land and ocean outgas. On land, due to falling˚C in this phase, soils outgas less but plants grow less due to less fertilisation.
For VCE and ocean carbon response see the 2 screenshots.
The CCE simulations (the ones which all have the same total cumulative emissions) react the same. The authors note that this is consistent with previous findings: in the long run, only cumulative emissions set the tone.
The CCE simulations (the ones which all have the same total cumulative emissions) react the same. The authors note that this is consistent with previous findings: in the long run, only cumulative emissions set the tone.

Wrt efficiency of artificial CO2 removal. (efficiency ≠ necessary?)
Larger CO2 removal leads to more outgassing. So by year 2200, only half of annual negative emissions do result in lowering ppm!
This means, removal efficiency is better with higher CO2 ppm and slower removal.
Larger CO2 removal leads to more outgassing. So by year 2200, only half of annual negative emissions do result in lowering ppm!
This means, removal efficiency is better with higher CO2 ppm and slower removal.
Conclusion:
Only if atmospheric CO2 is returned to pre-industrial levels, and the net radiative flux at the top to the atmosphere is zero or negative, will sea level start to fall and stabilize in the long term.
Only if atmospheric CO2 is returned to pre-industrial levels, and the net radiative flux at the top to the atmosphere is zero or negative, will sea level start to fall and stabilize in the long term.
During periods of net negative emissions, artificial CO2 removal is opposed by CO2 outgassing from marine and terrestrial carbon sinks, with the amount of outgassing increasing with the total amount of negative emissions.
Variations in the timing and amount of peak CO2 emissions, maximum emission reduction rate and total amount of negative emissions would not affect the long-term Earth System response as long as the net cumulative CO2 emissions are the same.
Earth system responses not included in our analysis, such as sea level rise from melting ice sheets and permafrost-carbon cycle feedbacks, are expected to reduce the reversibility of anthropogenic climate change even further due to their long timescales. Our results suggest that
while negative emissions at the scale of deployment considered here, allow to restore global mean surface air temperature to a lower level,
they are ineffective at reversing responses in climate system components with long response timescales such as thermosteric sea level rise
they are ineffective at reversing responses in climate system components with long response timescales such as thermosteric sea level rise
We conclude that while carbon dioxide removal may be a helpful tool in conjunction with other efforts aimed at reducing the rise in atmospheric CO2, it is not a silver bullet to restore the climate system to a desirable state on timescales relevant to human civilization...
• • •
Missing some Tweet in this thread? You can try to
force a refresh


