How should we think about the ideal size of fiscal stimulus right now? A thread with two approaches: (1) top down (based on filling the macro hole) and (2) bottom up (based on protecting people).
Three distinct issues:
(1) When do we need money? Simple: two months ago.
(2) How long do we need money? As long as it takes, could be years, ideally would have triggers to continue after Congress is fatigued.
(3) How much per month? Rest of thread is on this question.
(1) When do we need money? Simple: two months ago.
(2) How long do we need money? As long as it takes, could be years, ideally would have triggers to continue after Congress is fatigued.
(3) How much per month? Rest of thread is on this question.
A top down approach would ask what the output gap is and what the multiplier is. CBO's July forecast put the output gap at 6% in Q4, at a time when they expected the UR to be 10.5% this quarter. So presumably they would say something smaller, maybe 4%. cbo.gov/system/files/2…
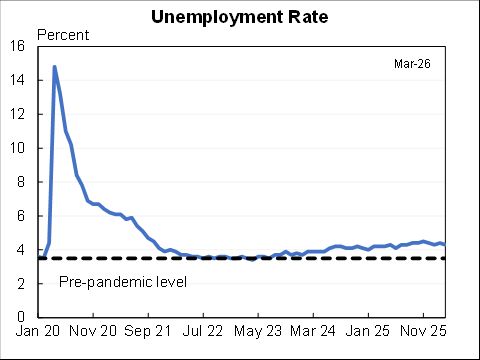
Alternatively, Okun's Law says the output gap is 2*(7.9% unemployment - 3.4% full employment rate) = 8%. Let's round that up to 10% which could reflect the higher "realistic" unemployment rate, a further outbreak that hurts the economy more, or a lower full employment rate.
Next we need a multiplier. Most advocates of stimulus I see on twitter tout multipliers like 1.5. On the other hand, this may be too high and the very short-term multiplier might be lower, as low as 0.5. Let's use both.
Finally we can combine these with the fact that monthly GDP is $1.8T and get the following needs for monthly stimulus for the 0.5 multiplier / 1.5 multiplier case:
If the output gap is 4%: $36b / $108b
If the output gap is 10%: $90b / $270b
If the output gap is 4%: $36b / $108b
If the output gap is 10%: $90b / $270b
If legislating for 6 months then the total ranges from $216 billion to $1.6 trillion.
I would want to err on the side of more, I worry the output gap will remain large, and that the short-run multiplier is low. So I would be at the top of that range.
I would want to err on the side of more, I worry the output gap will remain large, and that the short-run multiplier is low. So I would be at the top of that range.
Now a bottom up approach. I'll consider four elements:
(1) Health needs like testing. I'm no expert, will arbitrarily pencil in $30b/month.
(2) Unemployed.
(3) States/localities
(4) Everything else
(1) Health needs like testing. I'm no expert, will arbitrarily pencil in $30b/month.
(2) Unemployed.
(3) States/localities
(4) Everything else
Second, how much do we need for the unemployed? Compensation in August was $56 billion below its pre-crisis trend. In theory for that amount of money could keep worker's whole (would still have lost business income etc.). That is about $350 billion over six months.
Alternatively, 28 million on UI or waiting to get on. If you support $600/week * 4.35 weeks per month that is $73 billion a month.
https://twitter.com/hshierholz/status/1311652660626378754?s=20
Three things might change that number:
PUA for gig workers etc. ends at the end of the year. Need ~$10b per month for it next year.
Continued claims falling, so likely lower than $73b for month.
I prefer $400/month given the economy.
Nets to lower but I'll stick with $70b.
PUA for gig workers etc. ends at the end of the year. Need ~$10b per month for it next year.
Continued claims falling, so likely lower than $73b for month.
I prefer $400/month given the economy.
Nets to lower but I'll stick with $70b.
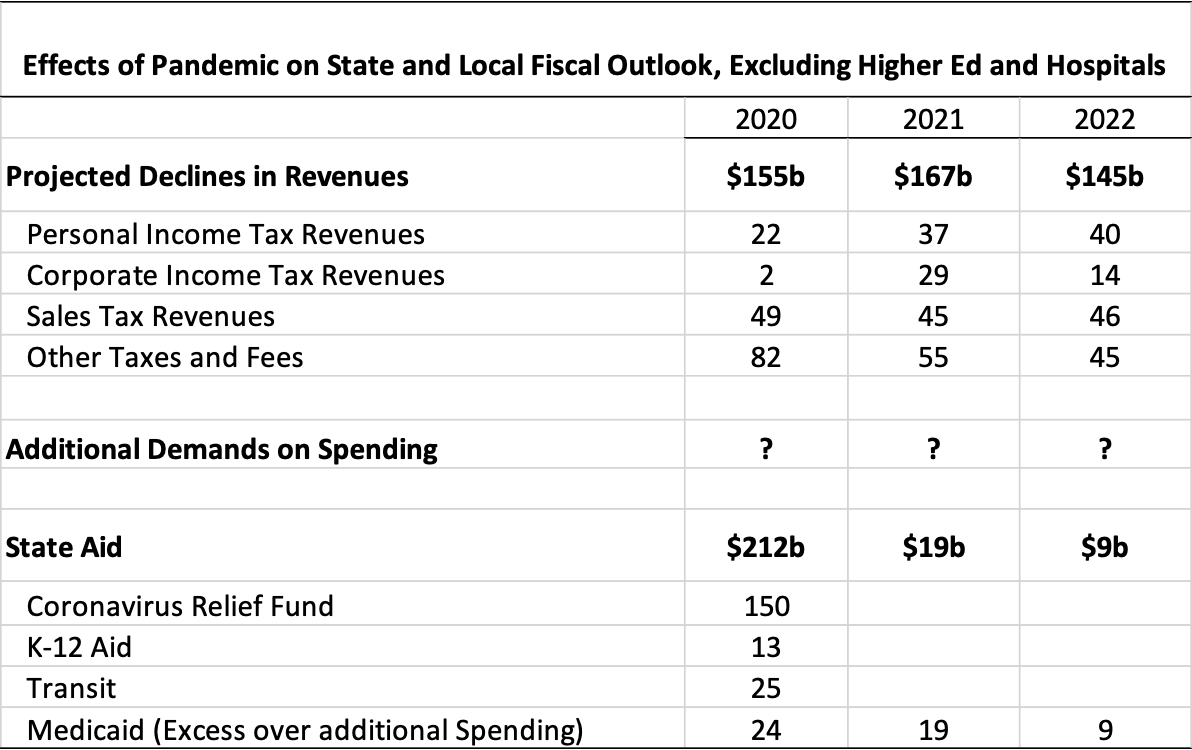
Third, how much is needed for states and localities? Auerbach, Gale and Sheiner put the *revenue* shortfall at $227b over three years. There is also additional demands on spending. Let's double the number and say $450b total, if over 6 months is $75b/month. 
Finally, everything else? A lot of people not eligible for UI, in fact most suffering during CARES period appears to have been people not getting UI not people getting too little UI. Mechanisms for this is checks, SNAP, child allowance, housing vouchers, etc. Call it $60b/month.
I don't have a good basis for this, but $60b per month is as much as we spend on SNAP in a normal year, so would be enough for a 12X expansion of that program. Or enough for stimulus checks every three months. Or enough to close the personal income shortfall not counting UI.
Oh, and I would allocate $0 to restoring the state and local deduction and twice as much as that to PPP.
So the bottom up approach gets you the following per month:
Health: $30b
UI: $70b
States: $75b
Other: $60b
TOTAL: $235b
That is a bit below the upper bound of the "top down calculation" and works out to $1.4 trillion over six months.
Health: $30b
UI: $70b
States: $75b
Other: $60b
TOTAL: $235b
That is a bit below the upper bound of the "top down calculation" and works out to $1.4 trillion over six months.
In conclusion:
--The sooner the better
--The longer the better (with triggers)
--Erring on the side of large gets you about $250b per month if the legislation lasts for six months.
--The sooner the better
--The longer the better (with triggers)
--Erring on the side of large gets you about $250b per month if the legislation lasts for six months.
• • •
Missing some Tweet in this thread? You can try to
force a refresh