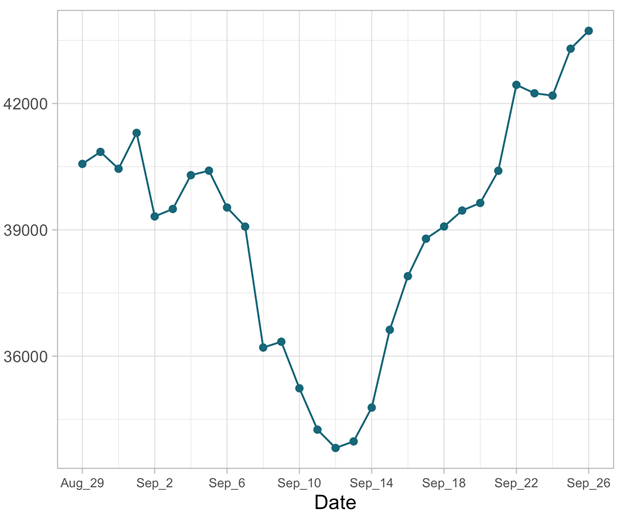
While nation is distracted with Presidential tweets, FDA rules and CDC guidance...

COVID cases are continuing to rise

Today's numbers are out and they are heading in wrong direction.

Averaging close to 45K cases a day

But underlying data more concerning

Thread
All data from @COVID19Tracking using 7-day moving averages

White House Task Force designates states as red, yellow, or green based on cases over the past week

Based on their cut-points

25 states are now in red zone

25 states + DC in yellow zone

No greens

2/n
In red zone, out of 25 states

18 have rising cases over past 2 weeks

15 have rising test positivity

13 have test + > 10%

20 have increasing hospitalizations

So in red zone, states have lots of cases and are getting worse

Not good. Need action to stem tide

3/5
Situation in yellow zone. Of 25 states + DC

17 have rising cases

15 have rising test pos

only 1 state test + >10%

These states are starting with low baseline, but generally rising

Action now would be less painful

And in green states?

No green states 😦

4/5
So here's the bottom line

Most states with rising case counts

Majority of states with rising test + meaning missing more cases over time

Oh, and hospitalizations are up in 38 states

We as a nation need to return to basics

And control the virus before the winter arrives

Fin

• • •

Missing some Tweet in this thread? You can try to force a refresh
 

Keep Current with Ashish K. Jha

Ashish K. Jha Profile picture

Stay in touch and get notified when new unrolls are available from this author!

Read all threads

This Thread may be Removed Anytime!

PDF

Twitter may remove this content at anytime! Save it as PDF for later use!

Try unrolling a thread yourself!

how to unroll video
  1. Follow @ThreadReaderApp to mention us!

  2. From a Twitter thread mention us with a keyword "unroll"
@threadreaderapp unroll

Practice here first or read more on our help page!

More from @ashishkjha

8 Oct
Have been getting asked a lot about whether its safe for President Trump and VP Biden to debate in person on October 15.

So here are some thoughts.

Bottom line: depends on how luck we feel

But here's a bit more detail

Thread
CDC recommendations for isolation for people with mild to moderate disease is 10 days after symptom onset.

If we assume symptom onset was October 1, then debate Oct 15 should be fine

But for "more severe" disease, infected people remain infectious out to 20 days

2/n
But there's a twist

President got steroids early in disease course (day 3) which likely affects duration of viral shedding

Steroids likely extend shedding of SARS-CoV2

We saw this with MERS (another coronavirus) and have some evidence with COVID

frontiersin.org/articles/10.33…

3/n
Read 5 tweets
2 Oct
President was diagnosed with SARS-CoV2 infection evening of Oct 1.

First and foremost, we wish him and FLOTUS a speedy recovery

We also need to sort out who else has been infected

Incubation period of the infection is 2-14 days but reality is that its usually 3-5 days

Thread
So, depending on when he was previously tested, reasonable to assume following:

He was likely infected between Saturday and Monday.

Could have been earlier or possibly Tuesday (though unlikely)

If he was infected over w/e, he was infectious to others Tuesday on

2/4
It is not clear who infected the President

It might be Ms. Hicks but also possible they had common source

So what does that mean?

This will be a big contact tracing effort.

Everyone who has been near the President at least from Saturday, on needs to be identified

3/4
Read 6 tweets
1 Oct
Was on @CNN talking Wisconsin, campaign rallies coming up this weekend

So how are things going with COVID in Wisconsin?

Pretty bad

New daily COVID cases per capita is 3X the White House threshold for a “red zone”

So let's talk data

Thread

So some data:

Wisconsin currently generating 42 cases/100K/day.

That’s # 3 in the nation after the Dakotas.

And things have been getting worse all month.

2/6
Sept 1:

750 cases
8.8% test positive
305 hospitalized
5 people dying daily

Sept 30:

2400 cases
21% of tests positive
595 hospitalized
10 daily deaths

Staggering changes in a month

More than tripling of cases, doubling of test positivity, hospitalizations and deaths.

3/6
Read 6 tweets
30 Sep
About to testify to to House @EnergyCommerce committee about a pathway to safe effective vaccines

3 key points:

1. Science has gotten us here so fast.

People are losing faith in vaccines because of politicization. We must not let that happen.

Thread

We must let science, not politics drive the timeline to EUA

2. We need to ensure equitable distribution -- not repeat our mistakes from testing where pro teams, WH get testing but teachers and nurses don't

2/4
3. We need to eliminate financial barriers to the vaccine. A third of Americans say they won't get the vaccine for financial reasons. We can't allow that to be a barrier.

If we do our job, we can have safe, effective vaccines that are widely available sometime in 2021

3/4
Read 4 tweets
27 Sep
Its been nearly 3 weeks since Labor Day

We were all worried about surge after holiday

Has it happened?

Actually, yes

Data here pretty clear

First, here’s a graph of the number of new daily cases (y-axis) over past month

7-day moving averages

What does this mean?

Thread
Cases slowly declining as we entered September

Labor Day weekend 9/5-7

If holiday set off new infections...you’d expect to see cases rising 5 to 7 days later (around 9/12)

That’s exactly what we see in graph

So 2 weeks ago, we were at 34K/day

Today, at 44K/day

Up 30%

2/7
39 states have more cases today than just 2 weeks ago

31 states have higher % of tests returning positive

And 16 states have % test positive > 10%

That’s not great. Those 16 states are missing a lot of infections

But patterns vary across states. So let’s dive in

3/7
Read 10 tweets
16 Sep
.@CDCgov out with metrics to guide school reopenings.

I like it. It sets out risk levels based on key metrics using a color scheme

But if you apply their metrics, the news isn't good.

Most of the country is in red or orange

Thread

cdc.gov/coronavirus/20…
Three key criteria:

1. # of cases in community
2. % of test positives
3. # of mitigation strategies you can do

Cases in the community: range from <5 per 100K/14 days as dark green to >200 as red

% pos <3% dark green to >10% red

So how do communities across America fare?

2/n
We applied these two criteria to states+DC

What did we find?

20 states in red "highest risk"
28 states in orange "higher risk"
2 in yellow "moderate risk"
1 light green "low risk"
0 dark green "lowest risk"

Ah you say -- states too big. How about counties?

3/n
Read 8 tweets

Did Thread Reader help you today?

Support us! We are indie developers!


This site is made by just two indie developers on a laptop doing marketing, support and development! Read more about the story.

Become a Premium Member ($3/month or $30/year) and get exclusive features!

Become Premium

Too expensive? Make a small donation by buying us coffee ($5) or help with server cost ($10)

Donate via Paypal Become our Patreon

Thank you for your support!

Follow Us on Twitter!