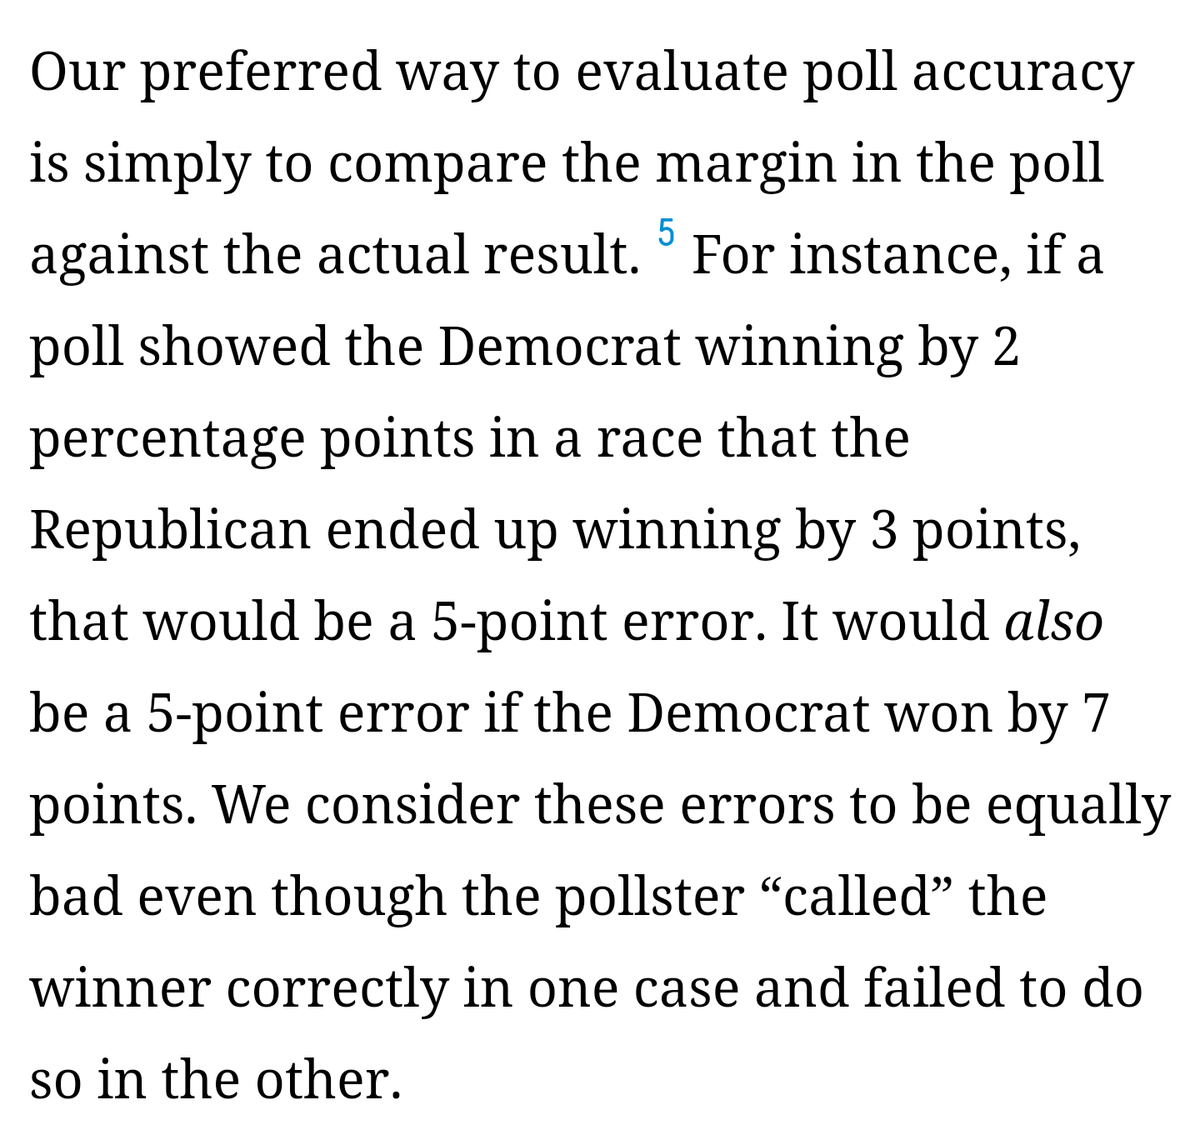
So here I'm going to start a Forecast thread
First up, the general election forecast. This is basically a blended model of my lean-Trump and lean-Biden undecided models, with weight to the lean-Biden because there's evidence to suggest the undecideds - while fewer - will break D
First up, the general election forecast. This is basically a blended model of my lean-Trump and lean-Biden undecided models, with weight to the lean-Biden because there's evidence to suggest the undecideds - while fewer - will break D

Notably, in this forecast, Biden relatively easily wins the major swing states.
The most contentious states are Iowa, Ohio, Texas, and Georgia with Biden narrowly winning Iowa and Georgia and narrowly losing Iowa and Texas.
Remember, these are just probabilities, not concrete
The most contentious states are Iowa, Ohio, Texas, and Georgia with Biden narrowly winning Iowa and Georgia and narrowly losing Iowa and Texas.
Remember, these are just probabilities, not concrete
Put another way, my forecast comes out like this.
I wouldn't be shocked if Trump held Iowa and Georgia, nor if Biden took Ohio and Texas. Beyond that, a close election in NC, PA, or FL? Not really seeing it being closer than 2-3 pts as of now
I wouldn't be shocked if Trump held Iowa and Georgia, nor if Biden took Ohio and Texas. Beyond that, a close election in NC, PA, or FL? Not really seeing it being closer than 2-3 pts as of now

1/2
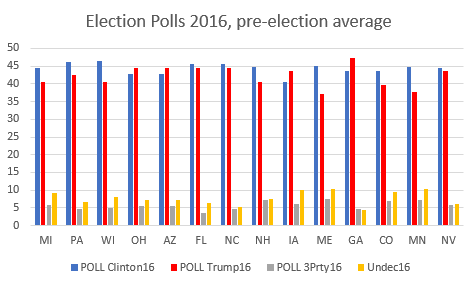
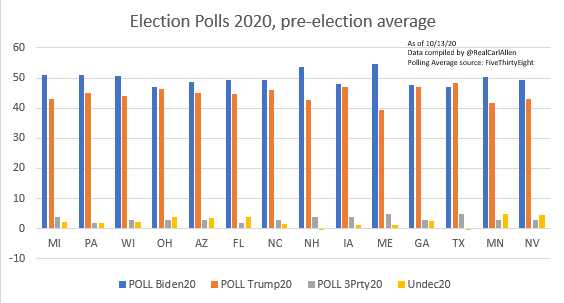
My forecast differs from @FiveThirtyEight "projected vote share" by more than 1% in the following areas, my forecast listed first:
Trump MI (44.4 vs 45.5)
Biden WI (51.5 vs 52.9)
Biden OH (48.1 vs 49.6)
Biden AZ (51.9 vs 50.8)
Trump AZ (45.4 vs 47.9)
Trump FL (46.5 vs 47.7)
My forecast differs from @FiveThirtyEight "projected vote share" by more than 1% in the following areas, my forecast listed first:
Trump MI (44.4 vs 45.5)
Biden WI (51.5 vs 52.9)
Biden OH (48.1 vs 49.6)
Biden AZ (51.9 vs 50.8)
Trump AZ (45.4 vs 47.9)
Trump FL (46.5 vs 47.7)
2/2
Trump NC (47.2 vs 48.5)
Biden NH (55.5 vs 54.3)
Trump NH (43.0 vs 44.8)
Biden ME (56.9 vs 55.4)
Trump ME (40.4 vs 43.1)
Trump GA (47.4 vs 50)
Trump TX (49.74 vs 51.1)
Biden NV (55.5 vs 52.7)
Trump NV (42.0 vs 45.8)
They're more bullish on Trump in 9 states, on Biden in 2.
Trump NC (47.2 vs 48.5)
Biden NH (55.5 vs 54.3)
Trump NH (43.0 vs 44.8)
Biden ME (56.9 vs 55.4)
Trump ME (40.4 vs 43.1)
Trump GA (47.4 vs 50)
Trump TX (49.74 vs 51.1)
Biden NV (55.5 vs 52.7)
Trump NV (42.0 vs 45.8)
They're more bullish on Trump in 9 states, on Biden in 2.
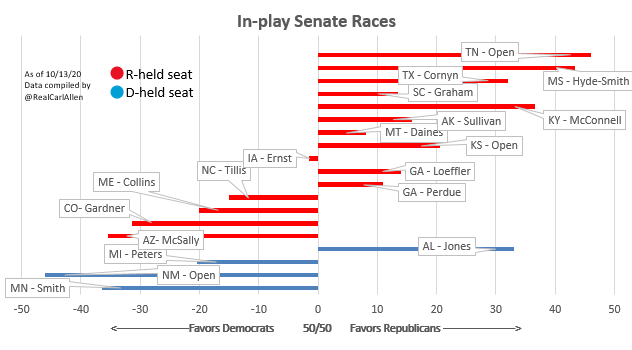
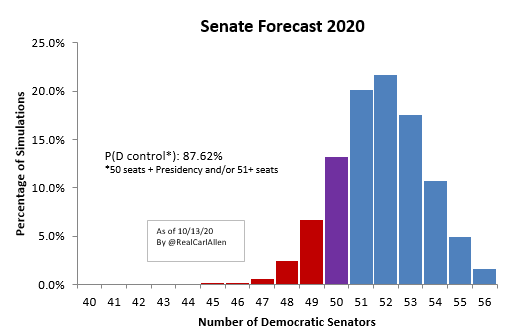
Here are my updated Senate probabilities.
A few discrepancies from 538 (my % first)
AZ: 85%D vs 78%
MN: 87%D vs 93%
ME: 70%D vs 62%
GA: 39%D vs 26%
GA-S: 36%D vs 29%
AK: 34%D vs 22%
SC: 36%D vs 23%
KY: 13% D vs 4%
MT: 41%D vs 31%
A few discrepancies from 538 (my % first)
AZ: 85%D vs 78%
MN: 87%D vs 93%
ME: 70%D vs 62%
GA: 39%D vs 26%
GA-S: 36%D vs 29%
AK: 34%D vs 22%
SC: 36%D vs 23%
KY: 13% D vs 4%
MT: 41%D vs 31%
I have D control Senate at ~87%, compared to 69% for @FiveThirtyEight.
Notably, they have a very wide distribution of outcomes.
I have the most common outcome as 51 or 52 Dem seats at ~20%, followed by 53 at 17% and 50 at 13%.
Their most common outcome of 51D is just 14%
Notably, they have a very wide distribution of outcomes.
I have the most common outcome as 51 or 52 Dem seats at ~20%, followed by 53 at 17% and 50 at 13%.
Their most common outcome of 51D is just 14%

Their model suggests there's a 20% chance that the Senate DOESN'T fall within R+2 to D+5
I have that as a 4% chance. That's big.
If I were a betting man, I'd take them up on their probability of 51 and 52 Dem seats (14% and 12.6%, respectively) at roughly +600 and +700 odds
I have that as a 4% chance. That's big.
If I were a betting man, I'd take them up on their probability of 51 and 52 Dem seats (14% and 12.6%, respectively) at roughly +600 and +700 odds
• • •
Missing some Tweet in this thread? You can try to
force a refresh