For pivot point enthusiast:
Have done some data analysis on where nifty opens and where it closes in terms of pivot points. Have used 2 parameters
Where nifty opens-[above pivot, above R1, below pivot, below S1]
Where nifty closes-[abv pivot, abv R1, below pivot, below S1] (1/5)
Have done some data analysis on where nifty opens and where it closes in terms of pivot points. Have used 2 parameters
Where nifty opens-[above pivot, above R1, below pivot, below S1]
Where nifty closes-[abv pivot, abv R1, below pivot, below S1] (1/5)

example looking at open location data : -
Opened above pivot - 44%
Opened below pivot - 30%,
Opened above R1 - 18%
Opened below S1 - 8%
If we further breakdown each category in to where nifty closed that day for each category [where it opened] we get few datapoints.. (2/5)
Opened above pivot - 44%
Opened below pivot - 30%,
Opened above R1 - 18%
Opened below S1 - 8%
If we further breakdown each category in to where nifty closed that day for each category [where it opened] we get few datapoints.. (2/5)
How to Read data?
(3/5)
(3/5)

Few observations[not all]..
When nifty opens above R1 there is 80% chances it will close above pivot point
When nifty opens below S1 there are 87% chances it will close below pivot point
When nifty open below S1 then there are only 7% chances it will close above R1
(4/5)
When nifty opens above R1 there is 80% chances it will close above pivot point
When nifty opens below S1 there are 87% chances it will close below pivot point
When nifty open below S1 then there are only 7% chances it will close above R1
(4/5)
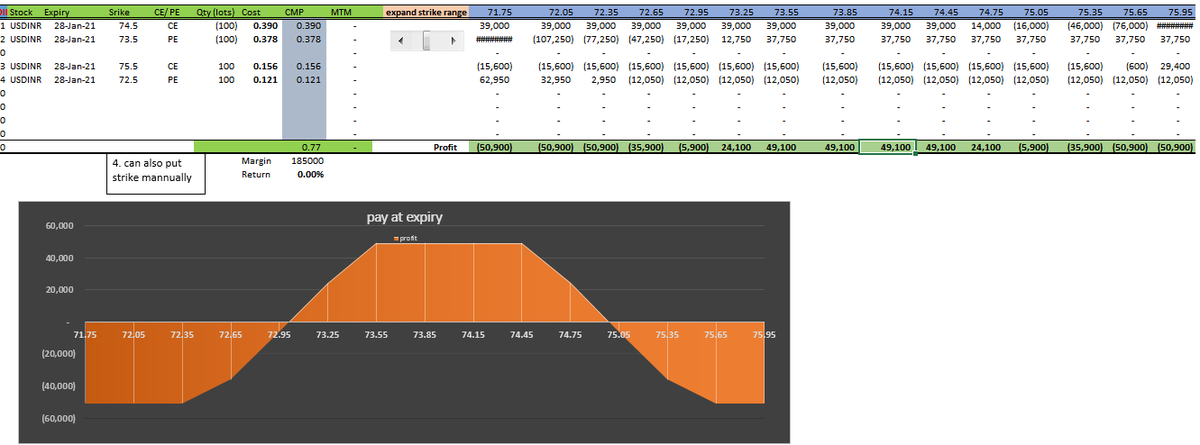
How you can use??
Can be used in strike selection for intraday option selling.
knowing the probability of where it will close looking at open type.
Use your creativity - there are many ways you can use this data.@jitendrajain @yogeeswarpal
(5/5)
Can be used in strike selection for intraday option selling.
knowing the probability of where it will close looking at open type.
Use your creativity - there are many ways you can use this data.@jitendrajain @yogeeswarpal
(5/5)
These are daily pivot points
• • •
Missing some Tweet in this thread? You can try to
force a refresh