Yogesh Nanda Profile picture
CA,Option Trader,Trainer at @scaliuminvest YouTube: https://t.co/DOjdExGAYR website: https://t.co/zzdYrNjEYF Telegram: https://t.co/sJXYWjUAuI
Shailesh Profile picture Sujal Profile picture Shubham Profile picture Virendra Profile picture Priyesh Kachhatiya Profile picture 8 subscribed
May 9, 2023 18 tweets 6 min read
Butterfly strategy:
This is my favorite strategy due to its risk reward Ratio

✍️What is butterfly 🦋:
The option butterfly strategy is a unique approach to trading that involves buying & selling options at different strike prices, creating a profit zone with limited risk

[1/n] butterfly strategy consists of 3 legs:

↔️buy ITM / ATM call 1 lot
↔️sell OTM calls 2 lot and
↔️buy far OTM call 1 lot

✍️Pay off graph:

[2/n] Image
Apr 12, 2023 7 tweets 2 min read
Took this trade yesterday.
Tata motor Call butterfly but with some tweak. offering almost 1:10 RR.

does it mean am i going to realise 10R?

Answer is no.

What i like most about butterfly is risk part.
(1/n) Image does all butterfly offer this high RR?

answer is no.

This is pay off as per yesterdays closing prices of tatamotors - butterfly 460 - 475 -490.

if taken as per yesterday closing prices RR was 1 : 3.3.

so how to increase RR?

(2/n) Image
Aug 1, 2022 7 tweets 3 min read
As we already discussed Auto and FMCG were first movers in this recovery
M&M was leader in this recovery today also up 5%
in hindsight its all good but identifying those few stocks from the basket of hundreds of stocks is herculean task
lets try to simplify the process
[1/n]
🧵 One approach is:
1. identifying a leading sector
2. identifying a leaders within those sectors.
3. Analyzing individual charts for detailed view and finding entry & SL levels

step 1 could be easy as we have to just scan 8-10 sector charts and can find the leaders.but part
[2/n]
Aug 13, 2021 7 tweets 4 min read
Where i find my winners?
ok, nice question. let me start with example - from these two on whom you bet your money?

answer is obvious right?

but while trading... many people do otherwise
(1/n) now same question for stocks..
where you bet your money?

When we have comparable option side by side - our answer will change.

but in live trading our we gets kick in finding a bottom and we love to boast about that.
(2/n)
Jan 30, 2021 7 tweets 2 min read
Thread on budget day nifty movement:
Few data points for budget day.
1. Average range for day 2.4% - can use this range of intraday strike selection.
2. When nifty fell >1.5% before budget - post budget nifty rises >2% in next 4 days -
@jitendrajain @yogeeswarpal
(1/4) can use this data for taking a risk defined bullish position.
3. If we compare low post event and high post event.. On majority of occasions nifty has seen a recovery in next 4 days [average low is -1% and avg high 2.7%] - this also indicates on bullish side…
(2/4)
Dec 16, 2020 11 tweets 5 min read
Thread on USDINR Trading:
Part of my capital i trade in USDINR - non-directional.
Past few months it traded in very narrow band - which is paradise for non-direction trading.
check chart.. last 3 months in just 2 Rs. Range
Today will share my December 2020 trade in USDINR

(1/4) Image Entry Date: 8th December [normally i take position 40 - 45DTE]
Trade: iron condor
Strikes: sold 74.5 Ce and 73.5 PE [Jan 21 expiry]
Hedge: bought 75.5Ce and 72.5PE [Jan 21 expiry]

qty: for illustration shown 100 lots..
margin needed : 1,81,000

(2/4) Image
Oct 24, 2020 8 tweets 3 min read
Trending markets are very tough for the option seller. So working on something which could find calmness in chaos. what I realised solution to this could be your Risk management [Mathematics for me]. (1/n) scenario 1:
with 60% success Rate on wining day you gain 30 points and on losing day you lose 30 points. so monthly you can make 4%. (2/n)
Oct 15, 2020 6 tweets 2 min read
For pivot point enthusiast:
Have done some data analysis on where nifty opens and where it closes in terms of pivot points. Have used 2 parameters
Where nifty opens-[above pivot, above R1, below pivot, below S1]
Where nifty closes-[abv pivot, abv R1, below pivot, below S1] (1/5) Image example looking at open location data : -
Opened above pivot - 44%
Opened below pivot - 30%,
Opened above R1 - 18%
Opened below S1 - 8%
If we further breakdown each category in to where nifty closed that day for each category [where it opened] we get few datapoints.. (2/5)
Oct 14, 2020 4 tweets 1 min read
INFY result Trade: Sold 1160CE & 1120PE for combined premium of 80 points.. Result is overnight so will hedge this position with 1220Ce & 1060PE at 3PM today.. Idea here is being ready with plan.. how i think in such trades.
1) entry in trade...
2) hedge for the trade...
3) Plan to reduce the hedge cost..
4) Exit target [in profit] in case of Small move..
5) adjustment plan in case of bigger move..
and most important part is point 5
Aug 3, 2020 9 tweets 2 min read
Thread on pre-earning trade:
Purpose : Earn from IV crush post result as uncertainty is over.
Which stocks: stocks with higher IVP(Iv percentile) and historical volatility lower then IV
Strategies: can do straddle or strangle / low risk iron fly or iron condor (1/n) How i play? : iron fly for overnight results (save from gap up like wipro/infy) and
straddles for results during market hours
This all is available if you google it : but key is how you manage post result.
no standard way to react so have your plan ready before trade.(2/n)
Jun 11, 2020 10 tweets 3 min read
Have been using ichimoku for sometime and this is very useful tool fir swing tradin. I use it for swing trading. Will share few tricks which i use.
Ichimoku cloud [Span B] breakout and retest of cloud level are two great tool
given below are few recent examples
@jitendrajain Zee- recent cloud breakout its retest and how trade entry taken on hourly chart. Image
May 19, 2020 8 tweets 3 min read
How to trade based on multi-time frame analysis and make a simple system. Have observed that in sideways market index oscillates between upper and lower band of bollinger band.
big question is how we can trade it. can be done by borrowing view from daily time frame (1/4) 
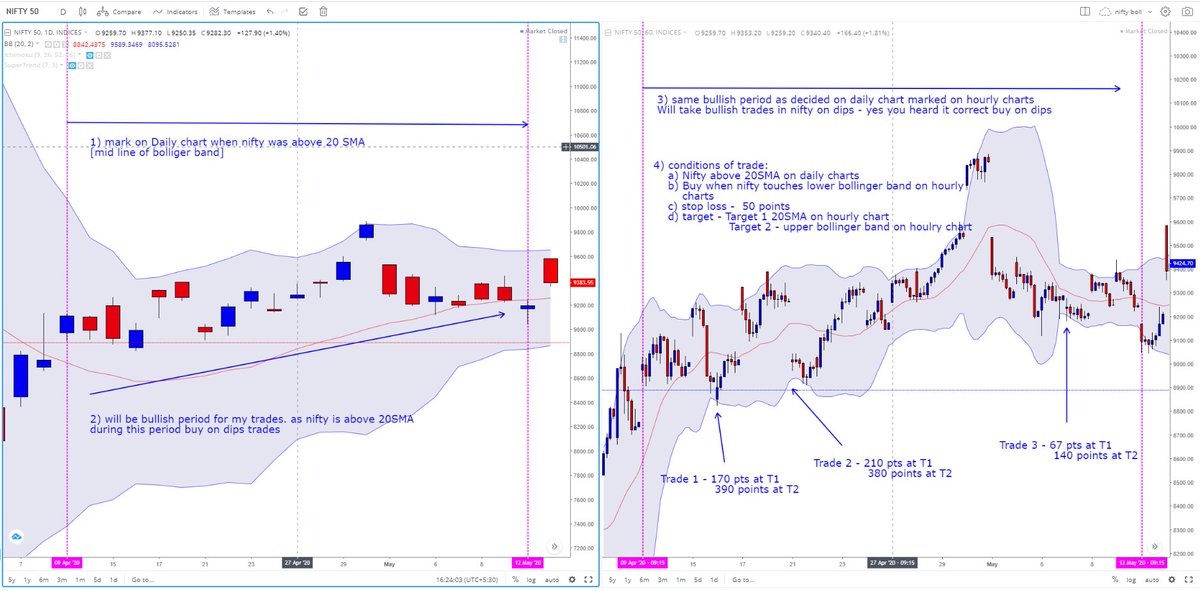
and execution based on hourly time frame. have tried to explain through attached chart. I know sample size is less but this is just and idea - pls do back-test on larger sample size

(2/4)@jitendrajain