
Fundamentals of Analytics and metrics- A thread
Summary of guest session by @Deepak_Singh100 at @10kdesigners Masterclass
(1/10)
Summary of guest session by @Deepak_Singh100 at @10kdesigners Masterclass
(1/10)
A designer should understand data because- ❓
1. Helps, quantify the Improvement- Feedback loop for your design choices. 👇
• You can get measurable insights on how exactly your design performed and impacted users.
(2/10)
1. Helps, quantify the Improvement- Feedback loop for your design choices. 👇
• You can get measurable insights on how exactly your design performed and impacted users.
(2/10)

2. Data helps you improve the product and backs your design decisions💹
3. You don't want to build something based on someones's opinion 🧠
4. Helps you level up as a designer, to become world-class. 👑
(3/10)
3. You don't want to build something based on someones's opinion 🧠
4. Helps you level up as a designer, to become world-class. 👑
(3/10)

Key Fundamental terms you should be familiar with-
1. Session- Session-duration is defined as the time frame during which there are regular active interactions occurring from a user on your platform. ⌛️
2. New user Vs Returning user 😍
(4/10)
1. Session- Session-duration is defined as the time frame during which there are regular active interactions occurring from a user on your platform. ⌛️
2. New user Vs Returning user 😍
(4/10)

3. Pageviews- How many views does each page/screen of the platform 👀
4. Bounce rate- measures the percentage of customers who visit a site one time and then leave.↗️↪️
(5/10)
4. Bounce rate- measures the percentage of customers who visit a site one time and then leave.↗️↪️
(5/10)
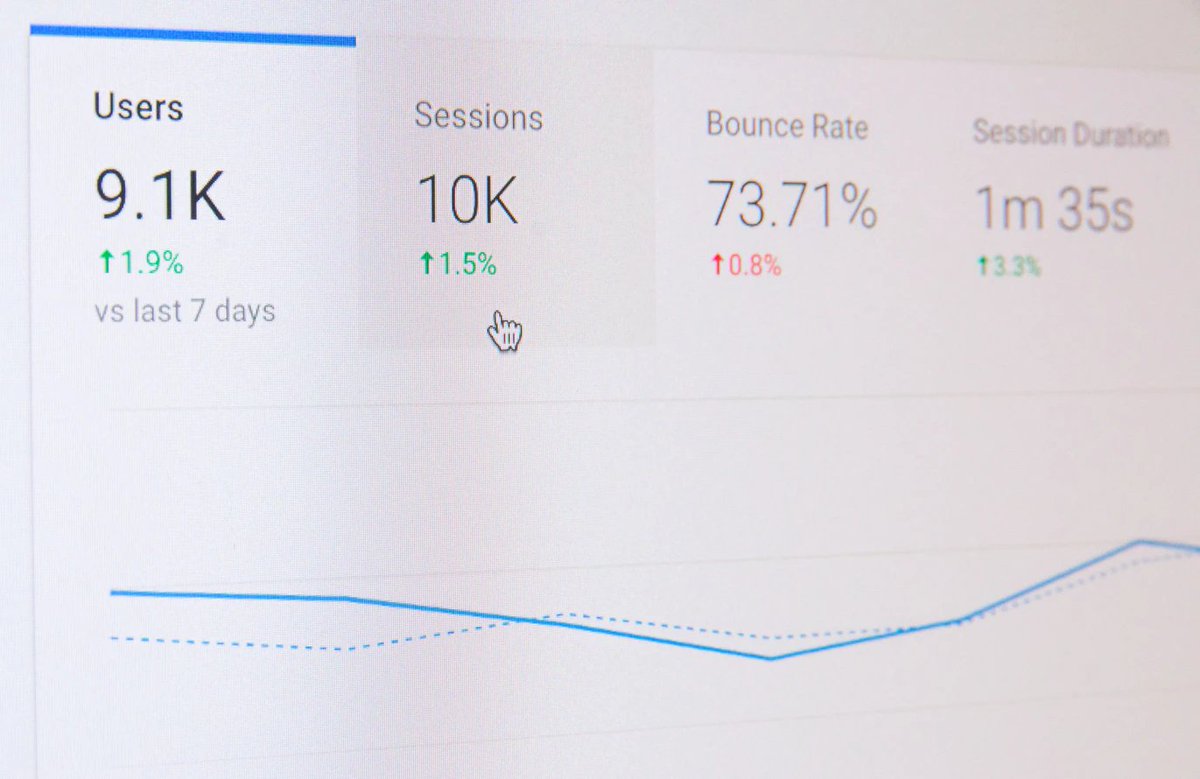
5. Average session duration- Duration of each session during the date range you specify and divides that sum by the total number of sessions.⏰
6. Segment- You can look for data for a particular segment of your whole user base according to demographics, age, gender etc🔞
(6/10)
6. Segment- You can look for data for a particular segment of your whole user base according to demographics, age, gender etc🔞
(6/10)

Some more important metrics for designers to consider-
• Conversion☑️
• Page load time🕗
• Time spent per user⏲️
• CTR ( Click through rate)🖱️
• Demographic distribution- Age, Gender, Geography🗺️
• Technographic distribution- Devices, Screen size, Network📲
(7/10)
• Conversion☑️
• Page load time🕗
• Time spent per user⏲️
• CTR ( Click through rate)🖱️
• Demographic distribution- Age, Gender, Geography🗺️
• Technographic distribution- Devices, Screen size, Network📲
(7/10)
So, what are some common tools that can be used to gather this data-
1. Google analytics - This is the most common tool that most of the organizations use to track data around products.
2. Mixpanel
3. Amplitude
4. Omniture
5. Localytics
(8/10)
1. Google analytics - This is the most common tool that most of the organizations use to track data around products.
2. Mixpanel
3. Amplitude
4. Omniture
5. Localytics
(8/10)

Don't always trust the data-
Pro tip-1 ✅
Know the difference between- Correlation and Causation.
This diagram explains this concept👇
(9/10)
Pro tip-1 ✅
Know the difference between- Correlation and Causation.
This diagram explains this concept👇
(9/10)

Pro tip-2✅
Get insights from both Qualitative and Quantitative data
❗️Quantitative data explains- What is wrong?
❗️Qualitative data explains- Why it is wrong?
(10/10)
Get insights from both Qualitative and Quantitative data
❗️Quantitative data explains- What is wrong?
❗️Qualitative data explains- Why it is wrong?
(10/10)
• • •
Missing some Tweet in this thread? You can try to
force a refresh


