Thread: Debt to Equity Ratio

The debt to equity ratio or D/E is a very common metric used to decipher the financial strength of the company. It is calculated by dividing Total Debt (TD) by Shareholder’s Equity (SE).
Total Debt is the sum of Short Term Borrowings (STB) and Long Term Borrowings (LTB) of the company. Shareholder’s Equity is the sum of Equity Share Capital (ESC) and Reserves & Surplus (RS).

So the expanded formula is
D/E = STB+LTB/ESC+RS
All the components of the formula are available in the Balance Sheet of the company which can be checked on various websites on the internet and also in the Annual Report of the company.
High D/E: It is an indicator of the fact that the company is relying more on debt to finance its operations as it running short of own funds.

Low D/E: It is an indicator that the company is well-capitalized by own funds and need not rely on or tap debt funding for its operations
Capital-intensive industries like manufacturing may have a high D/E ratio and it may be normal for that industry type. Whereas industries engaged in services and technology may need less capital and should therefore have low D/E as a normal.
Is there an ideal ratio? It is not right to generalize for the whole market as the intensity of capital required depends upon the industry we are analyzing. A ratio of 2 is very high and risky for the service industry and may be normal for the high capital industry.
One needs to be cautious while analyzing as to what type of industry is under the lens. Here one can look at the industry benchmark for comparing the D/E ratio.
So Debt to Equity is an important and essential concept in ascertaining if a company is using more of its own capital or dependent more on borrowed capital. This makes a very clear diagnosis of the financial health of a business.

By @harindersnanda

• • •

Missing some Tweet in this thread? You can try to force a refresh
 

Keep Current with Finsense Gurukul

Finsense Gurukul Profile picture

Stay in touch and get notified when new unrolls are available from this author!

Read all threads

This Thread may be Removed Anytime!

PDF

Twitter may remove this content at anytime! Save it as PDF for later use!

Try unrolling a thread yourself!

how to unroll video
  1. Follow @ThreadReaderApp to mention us!

  2. From a Twitter thread mention us with a keyword "unroll"
@threadreaderapp unroll

Practice here first or read more on our help page!

More from @FinsenseG

19 Oct
Thread: Price to Earnings Ratio

The price-to-earnings ratio or P/E is one of the most widely-used stock analysis tools used by investors and analysts for determining the stock valuation.
It is the ratio for valuing a company’s share market value with respect to the company’s earnings. Its calculated by dividing Market value per share (MPS) by Earnings per share (EPS)(MPS/EPS).
In addition to showing whether a company's stock price is overvalued or undervalued, the P/E can reveal how a stock's valuation compares to its industry group or benchmark like Nifty or Sensex.
Read 8 tweets
18 Oct
Thread: Term insurance by Government of India

Government of India launched Pradhan Mantri Jeevan Jyoti Bima Yojna (PMJJBY) on 9th May, 2015. The policy was originally mentioned in February 2015 by Arun Jaitley in his budget speech. But, it was launched by PM on 9th May 2015
This policy is a government backed life insurance scheme in India which is a pure term insurance scheme and very affordable too.

It is available to people between the age group of 18 to 50 and the maximum coverage period is till 55 years of age.
It offers a maximum sum assured of Rs. 2 lakh and as compared to other term insurance policy where the premium rate is high, PMJJBY policy offers premium at Rs.330 pa. In case of death of the policyholder before the coverage period, Rs.2 lakh will be provided to the nominee.
Read 6 tweets
15 Oct
Thread: The Magic Formula by Joel Greenblatt

The author of the book "The Little Book that Still Beats The Market" Mr. Joel Greenblatt shared a formula to assist small investors to pick winning stocks. It combines two factors: Return on Capital and Earnings Yield. Dive in.
ROC is a ratio of Pre-tax operating profits (EBIT) to Net Tangible assets (net fixed assets + net working capital).

EBIT: Earnings before interests and taxes
Net fixed assets: Gross fixed assets - Depreciation
Net working capital: Current assets - Current liabilities
This ratio tells us how much capital is actually required by the company and how efficiently they are converting the investments into profits.
Read 8 tweets
12 Oct
Thread: EBITDA Margins

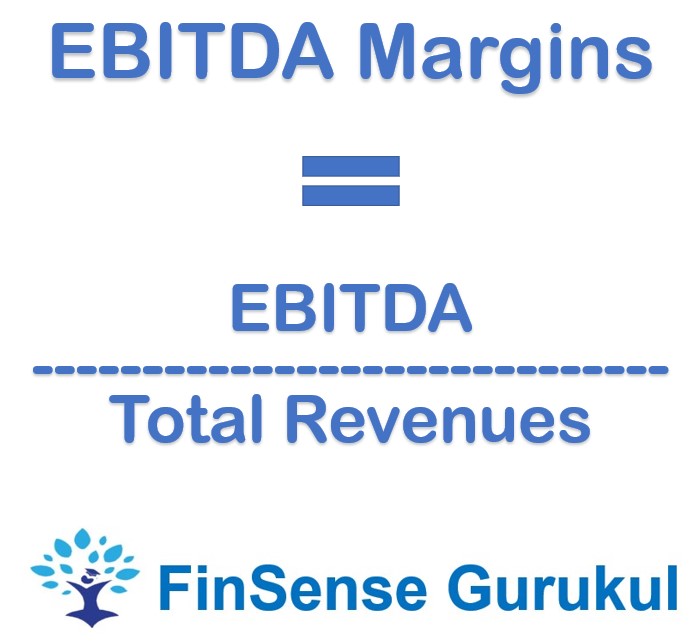
EBITDA: Earnings Before Interest, Taxes, Depreciation & Amortization is a measure of companies operating profit as a percentage of its revenue. Image
EBITDA margins can be used to do peer comparison within the industry. It depicts how much operating cash is generated by the company for every rupee in revenues.
A company with improving EBITDA margins should be looked upon favorably as it shows the efficiencies are being achieved through effective cost-cutting or improved capabilities.
Read 5 tweets
9 Oct
Thread: Debt Service Coverage Ratio (DSCR)

One way to judge the strength of a company is to check its ability to pay current outside obligations (interest+principal) from the income generated during the year. DSCR is an important ratio used by banks and financial institutions
Let's understand DSCR in depth.
Debt Service Coverage Ratio is calculated by dividing Net Operating Income (alternatively EBITDA) by Total Debt service costs. Debt service costs include interest to be paid on all existing loans along with the principal repayments during the year.
Let's take an example: A Ltd. has EBITDA of Rs. 200 crores during the current year. It has to repay Rs. 50 crores to lenders (Rs. 45 crores as principal and Rs. 5 crores as interest).
DSCR = Rs. 200 crores/Rs. 50 crores i.e. 4 Times.
Read 5 tweets
8 Oct
Thread: Working Capital Cycle (Operating Cycle)

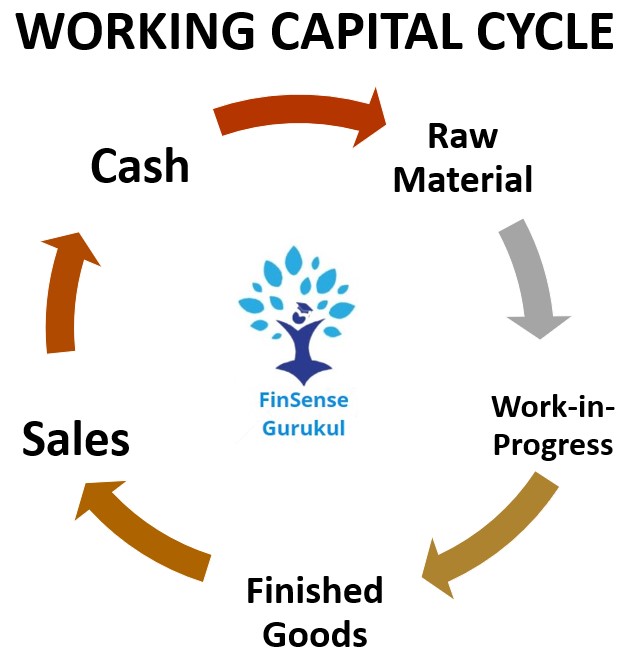
The book definition of WCC refers to number of days required for the entire process of business from the purchase of raw material to the realization from the customers.
Let us, deep-dive, into the process and understand how we can apply this in the analysis of a company.
Eg: A Footwear Manufacturer:

As the image above shows, first, the company procures raw material (rubber) and starts processing it to derive the final product that is Footwear.
The process involved is known as Work-in-progress and the final product is called Finished Goods. Once the raw material is converted into finished goods, they are sold to customers which concludes the Sales part of the cycle.
Read 7 tweets

Did Thread Reader help you today?

Support us! We are indie developers!


This site is made by just two indie developers on a laptop doing marketing, support and development! Read more about the story.

Become a Premium Member ($3/month or $30/year) and get exclusive features!

Become Premium

Too expensive? Make a small donation by buying us coffee ($5) or help with server cost ($10)

Donate via Paypal Become our Patreon

Thank you for your support!

Follow Us on Twitter!