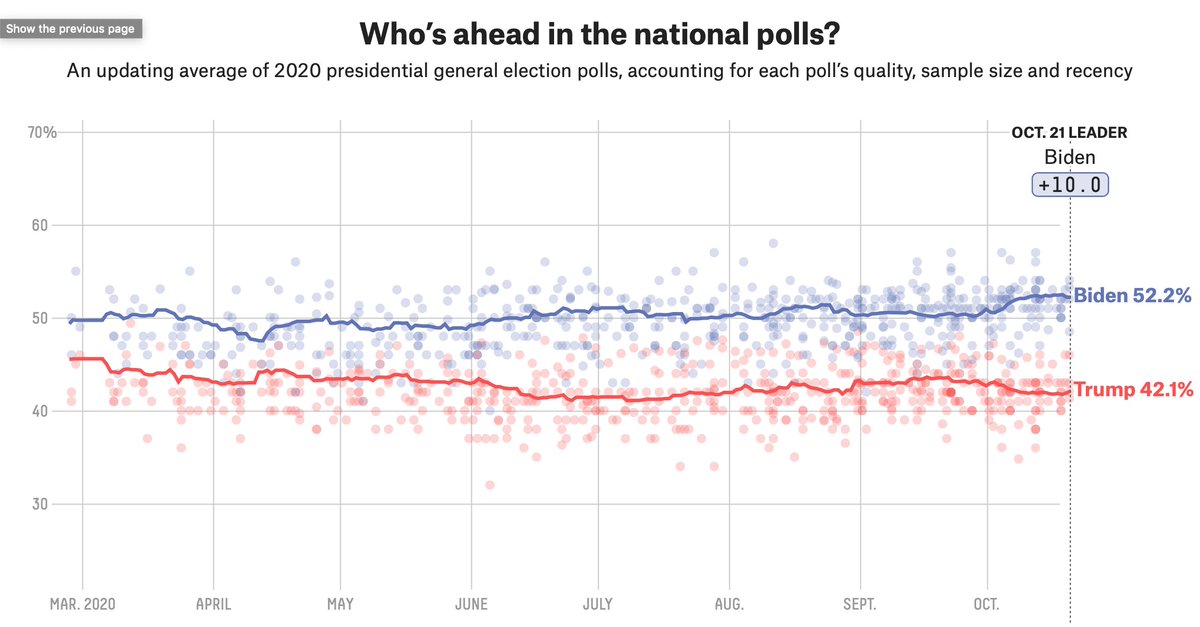
Hey folks, our national polling average is now Biden +9.2, as compared with Biden +9.7 yesterday. What caused the change given that the national tracking polls were decent for Biden this AM? It's older polls dropping out of the average.
Following major events like debates, our average shifts forward the window of time that it considers, and more recent polls have indeed been more consistent with a Biden lead of about 9 points nationally; haven't seen as many of those Biden +14s lately.
It's not perfect, and we'll probably tinker with these mechanics post-2020, but keep in mind that our averages are really a blend of an RCP style average over a fixed window of time (where this sort of thing happens a lot) and a HuffPost/Pollster style trendline.
I'd also note that this didn't have much effect on our *forecast*, which is mostly based on state polls and uses different mechanics for handling national polls to the extent it uses them at all. It shows Biden +8.0 in the popular vote, essentially unchanged from +8.1 yesterday.
• • •
Missing some Tweet in this thread? You can try to
force a refresh
I don't think it's really worth talking about individual polls from firms that have a poor track record and I wouldn't particularly trust to act in good faith.
And it's really the good faith part that matters. A firm that has a middling track record but I can trust to do honest work ... at least you can get some sense of direction from the poll. Different when the pollster seems to be engaged in a game to manipulate the media narrative.
Usually, manipulating the media narrative is what (some) partisan pollsters do. We include partisan polls in our averages but they're handled differently and weighed less. But there's a gray zone of firms that act like partisans even though they technically aren't by our rules.
It's definitely a source of uncertainty and different ways that pollsters are handling early and mail voting vis-a-vis likely voter models probably explains some of the differences we're seeing between polls right now.
I think there's *probably* more upside risk than downside risk for Democrats here (i.e. that turnout will be bluer than likely voter models project) but I can also imagine scenarios where it leads pollsters to underestimate the R vote instead.
For instance, if you had a fixed estimate of turnout (as X% of registered voters) and you put people who had already voted first in the queue, then mostly GOP election day voters might get crowded out. That's a weird way to do a likely voter model but some pollsters might do it.
Based on an update we'll be releasing later today, we're now projecting total turnout in the presidential race to be 154 million, with an 80th percentile range between 144 million and 165 million. In 2016, turnout was 137 million, by comparison.
The primary ingredient in our turnout estimate is polls that ask people whether they're more or less enthusiastic about voting than usual, and those polls are showing record levels of enthusiasm.
We've also increased our estimate based on academic research showing expanded voting options (e.g. no-excuse absentee voting) tends to increase turnout, as well as new @ElectProject estimates of the voting-eligible population, which is higher than what we'd used previously.
Obviously a fairly awful result for Trump in Michigan, but these other ones he can live with given that Fox News state polls have actually had pretty good numbers for Biden this year.
Overall, though, this was a day that brought some clarity. One of Trump's worst days of state polling in a while, but one of his better days for national polls, closing what had been a gap between them. Both now seem to point to perhaps a 9 or 9.5 point Biden lead nationally.
We also learned that high-quality polls in PA are continuing to cluster around a 6 or perhaps 6.5 point Biden lead, and high quality polls in Florida are +3 or +4 Biden, on average. That's what our model thought all along rather than being thrown off the scent by spammy polls.
You could probably convince me that the race has tightened by half a point. On the other hand, there had been a bit of a state poll vs. national poll gap, and Biden got some pretty good state polls this morning. projects.fivethirtyeight.com/polls/
As @Nate_Cohn wrote yesterday, there are also some reasons to think the race might tighten a bit. Indeed, that's what our model predicts (it has Biden winning the popular vote by ~8, not ~10). But Trump needs it to tighten by *more than a bit*. nytimes.com/live/2020/pres…
There's a ton of national polling so no one poll is going to influence our average much. And there's nothing intrinsically wrong with the IBD poll. But that won't stop some people from looking only at that poll and not the many other polls in the average.
Folks, Biden's lead didn't shrink from 7.3 points to 3.6 points in PA in a week (as per RCP) at the same time it was steady or slightly growing nationally. This is why you need poll averages that take a longer time horizon and/or adjust for house effects. projects.fivethirtyeight.com/polls/presiden…
RCP's averages are extremely subject to who happens to have polled the state recently, which is often the spammier, lower-quality pollsters, and that's been especially true recently with live-caller polls not having been terribly active in the states over the past 2 weeks.
I love many things about RCP, but if you have an average and 1/3 of it consists of Trafalgar and InsiderAdvantage and 0% of it consists of live-caller polls, it's not going to be a very reliable average.