An update post lockdown. Unfortunately, we don't have Google mobility data post-Oct 30th (start date of the lockdown) yet, so let's look at how hospital data changed since then. Quick thread.
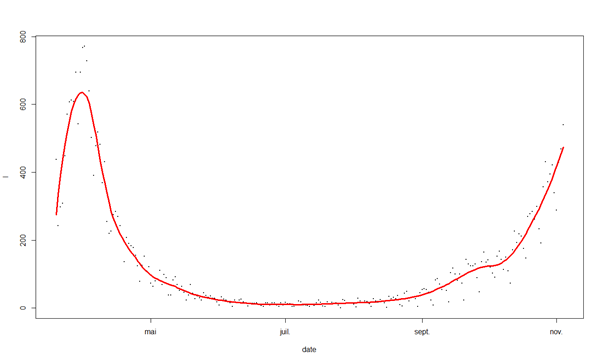
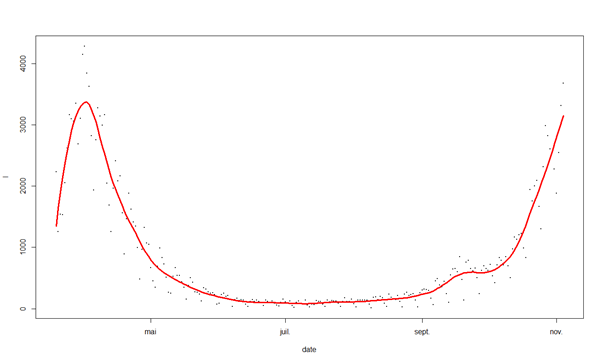
From worse to better, let's start with ICU. Incidence and non-parametric fit.
I certainly can't see any change.
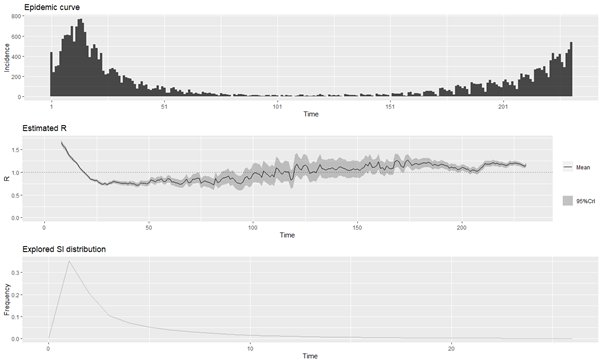
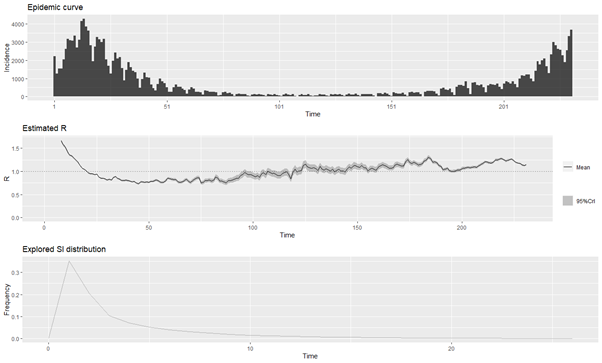
Confirmed by the statistical analysis of "R" for ICU data which is still hovering around 1.2
Hospital incidence now.
Same, conclusion: the curve looks the same.
Confirmed again by R estimate still around 1.2... BUT we can see a tiny little improvement in R.
Now if you remember the original thread, I found that cases and ICU/Hospitals were lagged vs. cases and also that any impact on mobility would need 8-14 days to show in hospital data. So we should see more effects of lockdown in cases. What do we have? This.
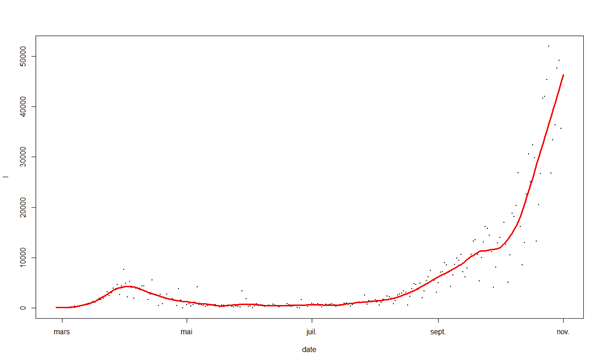
Ok, I realise it's not obvious, but the ugly exponential now looks slightly more like an ugly straight line. Not great, but is it better? R estimates for cases confirm it's better.
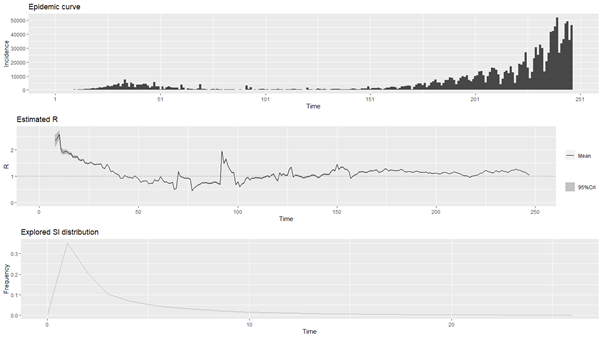
R is only slightly above 1 now.
BUT - and this is a BIG BUT (!) the drop in R is almost perfectly synchronized with school closures due to the school holidays.
So you have two ways of seeing this.
1) the lockdown is working and we just need to wait a bit to see the impact on hospital data
2) the schools closing drove R down... reopening it during the lockdown means the whole thing will fail.
For now, I can't tell from the data which is right. Maybe Google data will help
• • •
Missing some Tweet in this thread? You can try to
force a refresh
An old theme is coming back to haunt them: Basel 4!
Quick thread.
After almost 10y of discussion the package was finally enacted with full implementation in 2033.
Everyone felt, after many EBA reports & banks' disclosures, that impact would be mild.
But for first time banks are publishing capital ratios w/ the new rules and for DB it's ugly
How does it work? Banks are still allowed to use internal models, but the RWA (in 2030/2033) must be at least 72.5% of the standard (non internal models) RWA. ("output floors") and for DB that's a 33% increase!
CET1r would go from 13.8% to 10.35%! Ouch!
Why is the latest EC proposal on securitization a big deal for banks and how does it change the SRT market?
A slightly geeky thread - with some backround on the SRT market if you're not aware of this important market.
First what’s a SRT?
Following secular finance practice of reinventing the wheel but changing its name, the new trendy capital optimization transactions are “significant risk transfers”, but they’re just good old securitizations (invented in the 1860s 😊.)
(cash or synthetic)
The reason they’re now called SRT is a regulatory one.
The 2013 CRR (Art 244/245) allowed banks to get capital relief under some conditions, essentially that “significant risk” was transferred to someone else.
Bloomberg has some nice charts on the tariffs’ impacts.
The first one argues that tariffs on China are coming globally: too many countries will see a spike of imports from China & that's not sustainable.
The second shows GDP impacts, taking into account direct effects + indirect via trade partners (using a WTO macro model, so, you know...)
SE Asia impact is massive, -1% for EU, -1.3% Japan and -2.5% Korea. Mexico bonanza.
Some details on who’s going to stop which exports – very interesting split (especially if you try to model loan losses 😊). Overall 30% drop in US imports of goods (with retaliation modelled as 50% of US). China is -85%, Vietnam -75%, Taiwan, Japan, Korea Thailand -50%, EU -40%.
A week ago the Swiss gvt bravely decided to leave the decision on UBS capital requirement to Parliament.
I’m not sure that was such a great idea – as the recent proposal of the Swiss Social-Democratic Party shows.
If implemented, it would be a massive game changer. A thread.
First, a reminder: the SDP is not a fringe party, they’re #2 in the National council (41/200) & #3 in Council of States (9/46) & they’re also not particularly extreme (I mean, Swiss rarely are.)
But their proposals for UBS are a bit wild.
Let’s unpack.
1) A new leverage ratio surcharge of 3% for assets >300bn$ - in practice it means 40bn$ more capital required (out of approx 85bn of equity).
Ouch.
And having the biggest req on a non-risk adjusted basis is not exactly a very safe approach imho
Tomorrow is the end of the grace period for fentanyl-related tariffs (Canada Mexico), China ones r supposed to start on March 12. Time to look at some numbers. So far Trump has enacted 10% “fentanyl” tariffs on Chinese goods, enacted and cancelled 25% on Columbia and threatened :
Canada, Mexico (25% goods + 10% Canadian energy), China (+10% addtl), 25% steel & aluminium worldwide, “fees” for Chinese ships/freight operators, “reciprocal tariffs” (whatever that means) for all nations + 25% autos pharma & lumber, + unknown % on copper.
We’ll know more after the report on ‘America First Trade Policy’ on April 1st, especially on "reciprocal ones", but here are few thoughts from a great Autonomous report on this.
Some historical perspective: maybe raising tariffs in the early 1920 wasn’t a great idea?