@WontMarch4Soros @bedivere_knight @ColdPotatoSpud After thinking about the data / analyses I've been doing on the raw data vs website and other reports, I believe I have an explanation for why Rashid has so many more votes than Wittman. This will be a long explanation :
1. This explanation may bounce around a bit, but touches on different aspects of the pics I've posted across different threads. Ask questions if things don't seem to follow, since they are related.
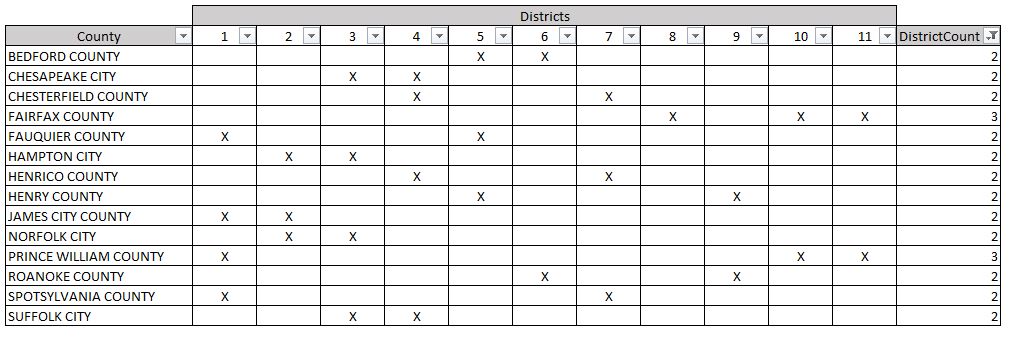
If we think about how elections work, different precincts will have diff ballots
If we think about how elections work, different precincts will have diff ballots
2. The ballots are different because downstream the (house reps) are different in the various districts. There are only two races that will be on every ballot across every district precinct. Senate and President. This is important.
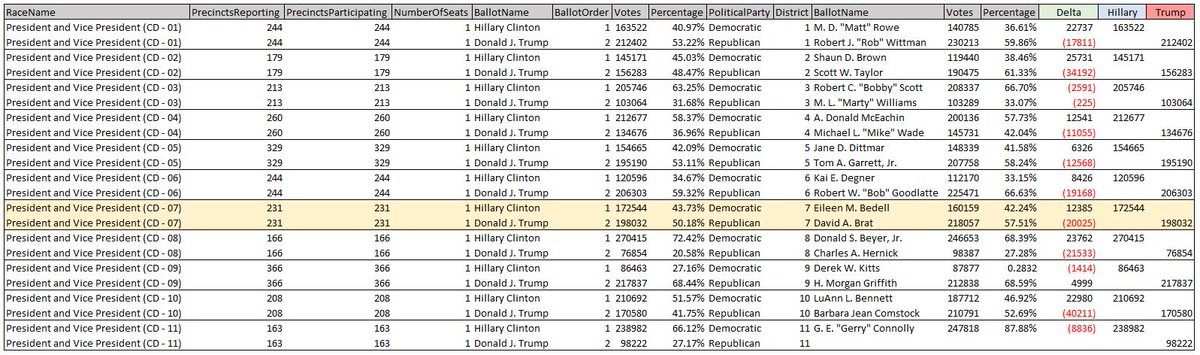
3. The reason we are seeing so many ballots cast for Prez / Senate but not down ballot is because it is necessary not to fill them out in order to distribute these headline votes across different districts. How does this tie into Rashid's high vote total?
4. There was a large number of ballots where he was selected over Wittman, but this was a mistake (not the plan). In order to tie to the ballots themselves, it's necessary to leave the votes for Rashid as is, but to "reduce" the number when reporting his race.
5. This also means that many of the suspect ballots came from CD-1, because Rashid's name was on the ballot, but should not have been filled in. Stafford County seems like the source for these ballots. By filling in CD-1, those involved threw a wrench in the plan
6. Based on the Edison data, a large chunk (80%/20%) Biden votes was added and removed from the totals (around 400K ballots). Since about half of these (200K), had Rashid filled in, it caused problems because the systems would assign these votes to Rashid.
7. The raw data shows these 200K assigned to Rashid via Stafford County Absentee Ballots. For audit purposes, these can't be shifted to CD-10 or CD-11, because the house rep race is different, and it would violate the data integrity of the system.
8. Only alternative is change reporting of the figures to chop off 200K votes from him or else it would be obvious there is something wrong in the district. For the Senate and Prez votes on these ballots, those votes can be distributed because they appear in all districts.
9. Hence why down ballot races show a big disconnect when compared to Prez and Senate figures. Assuming this was a small group of people, it would be necessary to inject these ballots into the process at a central point (CD-1), but rely on others upstream to distribute them.
10. This distribution was complicated by these Rashid ballots which should not have been filled in. But this leaves a crumb trail of what the plan was. Couldn't delete these votes or else it wouldn't match the ballots if an audit was conducted.
11. Where does this leave us? My suggestion would be to have Wittman "concede" to Rashid, and highlight this discrepancy. "The elections board has ignored 200K ballots that their own systems show were cast for Rashid". If Rashid isn't in on this, he may even want to pursue this.
12. Since these are "valid" votes, sure he would support have the elections board report the votes properly. This would be an opening to scrutinize the system and why Rashid has 383K of the ~570K active votes in the district. That's unbelievably high, and would invite questions
13. This raises another question. Within the voting system (where the raw data comes from), are people able to "split" ballots. This is a bit technical but think it through. Assuming a ballot is tied (at a minimum) a district, can the down ballot votes be segregated form the top?
14. Does the voting system tie individual votes to specific ballot barcodes in VA? If it does, a forensic review would show votes from CD-1 ballots, being accounted for in CD1-10 and CD-11 districts. Since 1 ballot = many votes (prez, senate, house rep), we would see
15. Senate and Prez votes, tied to a CD-1 in the system, but reported in CD-10 / CD-11. This would prove that meddling was done at the elections board to smooth out the lumps of these large injects of ballots. It is very difficult to hide all the signs of manipulation.
16. Again, this is contingent on the voting system tracking votes from a ballot, and a ballot from a source (county). More importantly, this may give us the clues we need to follow the ballots upstream to the counting process. This is critical to get them thrown out.
17. If there are audit trails of batches of votes / ballots being uploaded into the election system, then it would be possible to identify which batches contained the ballots / votes that were shifted to CD-10 / CD-11. From the upload point, can we trace this back further?
18. Depending on the rules for reporting vote totals / ballots, it may be possible to isolate where the 400K batch swings originated from (e.g Edison data going up and down). If that trial exists, from the voting system, down to where the votes came from, we have a chance to
19. Identify the specific ballots that were fraudulent. This gives investigators a head start on where to focus, without the fuss of looking for dead votes and trying to figure out which ballot that might relate to. This approach would start with the results and track backwards
20. to the batch of votes / ballots that were uploaded. I don't know much about how ballots / votes are stored / retained after tabulation, but assuming there is a link backwards. We could identify the ballots related to highly suspect swings in Edison data.
21. Perhaps it varies by State, but if possible, this approach could be replicated for each state with a suspicious dump of ballots / votes. It would be much more efficient, and it's targeted nature would be more palatable to a judge rather than tearing through all the ballots
22. I realize such an approach is not a guarantee, but large processes usually have links between the steps. Some are obvious and clear, others need to be derived and synthesized. But without more knowledge of the systems involved, I can only say this is a possibility.
23. Anyone with deep knowledge about vote / ballot counting knowledge, the tabulation process, and how totals are centralized in VA would help shed light on the feasibility of this approach. What other options are there to expose what has taken place?
• • •
Missing some Tweet in this thread? You can try to
force a refresh