FishingInfo Profile picture
Parler : @FishingForInfo Since releasing my analyses, notifications and messages have been deleted. I will release updates on both going forward.
William F. Swiggart Profile picture Head Hunters Profile picture 2 subscribed
Dec 13, 2020 14 tweets 3 min read
Virginia Vote Shifting Pattern - 2016 Edition: A key question raised in the 2020 election was about the large difference in top ballot races vs down ballot races. My analysis takes the votes of the Prez and subtracts the votes of the House candidate for Dems and Reps. Here's 2016 2. These figures come from the VA election results website. In 2016, the "Delta" column shows a surplus for Hillary, and a deficit for Trump in all districts except VA-3, VA-9, and VA-11. The highlighted row is VA-7 which we will examine more closely later in the thread.
Dec 9, 2020 21 tweets 5 min read
Understanding VA-7 Turnout Part 2 : From the last thread on VA-7, we explored two key anomalies :
1. Drop in R turnout in Henrico and Chesterfield Counties
2. Uniform >40% D turnout

This thread will explore a comparison in turnout with VA-4. Why VA-4? Henrico and Chesterfield. 2. For some background, there are 14 counties in VA that cover more than 1 district. See image. Here we see the counties on each row and the districts they cover in the numbered columns. Henrico and Chesterfield cover both district 4 and 7.
Nov 29, 2020 14 tweets 4 min read
Understanding VA-7 Turnout : As part of digging into the VA data sources, I've gone back to look at 2016 election results to understand the differences between the two. A key house is Virginia's 7th district where Abigail Spanberger(D) was defending her seat from Nick Freitas(R) 2. Spanberger won the seat in the 2018 election against incumbent David Brat. Result : ~176K (D) to ~169K (R). David Brat is famous for defeating Eric Canton in the Republican primary (first time a sitting House Majority leader had lost a primary).
Nov 14, 2020 12 tweets 3 min read
Limitations of High-Level Analyses Part 2 : Some out there are taking Dr Shiva's analysis and replicating it for Democratic votes to compare and see if the pattern is different. From a couple I've seen, there is a similar downward linear pattern that's less steep. 2. This has led some to conclude that this is in fact a natural pattern that has naturally occurred as the result of the local the electorate, and therefore, there's nothing untoward about the pattern. If it's happening for both Ds and Rs, it can't be a problem. Right? No!
Nov 14, 2020 21 tweets 4 min read
Limitations of High-level Analyses : After the Dr Shiva presentation, there has been a lot of effort dedicated to to understanding the pattern he showed in his graph. Many tweets speculating about the reason such a pattern might be true / reasonable. 2. Some have compared the graphs across elections (2016 and 2020) to understand how the trends compare and what the differences may mean in terms of the voters. While these analyses are interesting from an academic perspective, we should ask what is actually being compared?
Nov 13, 2020 18 tweets 4 min read
Deep Dive Explanation of Approach / Analysis : I want to provide the context of the work I am doing, and the reasoning behind it. I started this with a question : Why did R's do so well down ballot, and not at the top? In order to answer this question, I needed a suitable dataset 2. The ideal dataset would allow us to see, for each batch of ballots, the landscape of the votes (e.g. which candidates received the votes, and by what proportions). And not just any batch would suffice to perform this analysis.
Nov 12, 2020 10 tweets 3 min read
1. Change Log Update : Batch Analysis. As far as I know, there isn't a data source available of how batches of ballots voted. We see the batches in the Edison data feed, and can see their impact on the Dem / Rep %s. But that's for the President. What about down ballot? Let's see! 2. Seeing how Dem & Rep candidates performed down ballot compared to the Prez is a powerful insight that can tell us how more about what these batches contain. @va_shiva had a presentation about weighted race voting, and while I'm not familiar, the pattern I'm seeing might
Nov 11, 2020 14 tweets 4 min read
1. Change Log Update : I've spent some time going through the data to get a better understanding of the relationships between the rows, and how to identify batches of votes that were loaded into the system. I focused on the largest batches in CD-1, CD-10, and CD-11. 2. I was particularly focused on batches that had both Dem and Rep candidates for Prez, Senate, and House. The purpose was to compare the votes across the ballots. Expecting to see Prez with the largest numbers, and the Senate / House being lower numbers.
Nov 10, 2020 8 tweets 2 min read
Found another file on VA website. This one is a "Change Control" log for votes in the system. I've only begun to explore this, but there's some interesting activity for VA-7 for Spanberger. On Oct 30th, a preload change was initiated that would expire at 11/4 @ 4:13AM At 4:13AM, 66,498 votes are assigned to her with an expiration of 11/5 @ 11:26 AM. When this comes around, the total is adjusted to 63,687. Reason given is "Tabulation Error in Precinct". The last change has no expiration date. These changes affected Chesterfield County.
Nov 9, 2020 24 tweets 5 min read
@WontMarch4Soros @bedivere_knight @ColdPotatoSpud After thinking about the data / analyses I've been doing on the raw data vs website and other reports, I believe I have an explanation for why Rashid has so many more votes than Wittman. This will be a long explanation : 1. This explanation may bounce around a bit, but touches on different aspects of the pics I've posted across different threads. Ask questions if things don't seem to follow, since they are related.
If we think about how elections work, different precincts will have diff ballots
Nov 9, 2020 4 tweets 4 min read
@ColdPotatoSpud @bedivere_knight @Peoples_Pundit 4) The other odd thing in the turnout file is that Stafford County has a huge amount of absentee ballots that were cast "In Person", which you don't see in many of the other counties. Here's the details : 
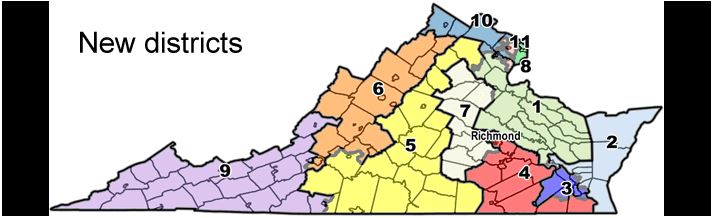
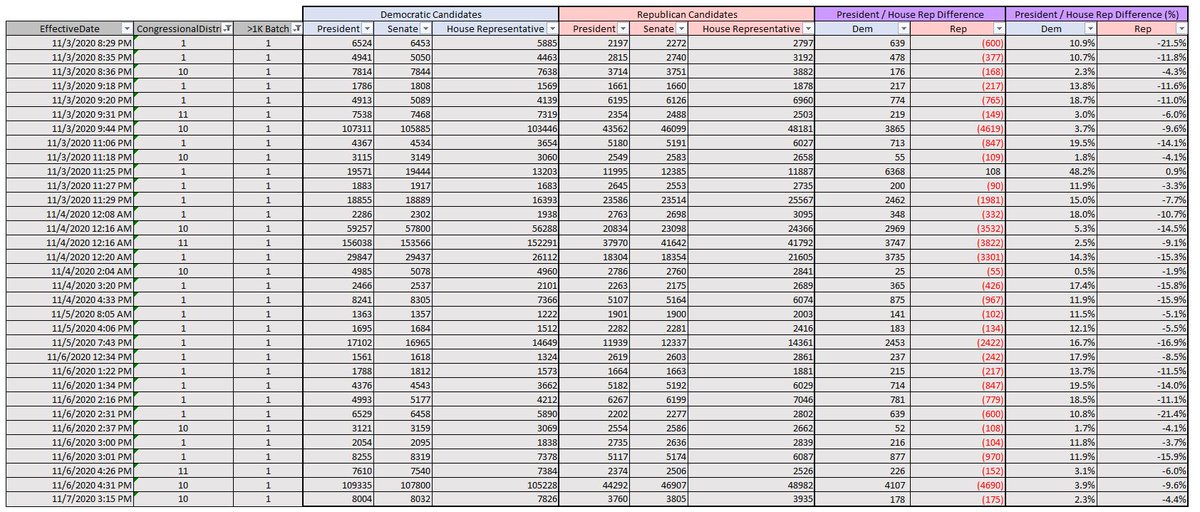
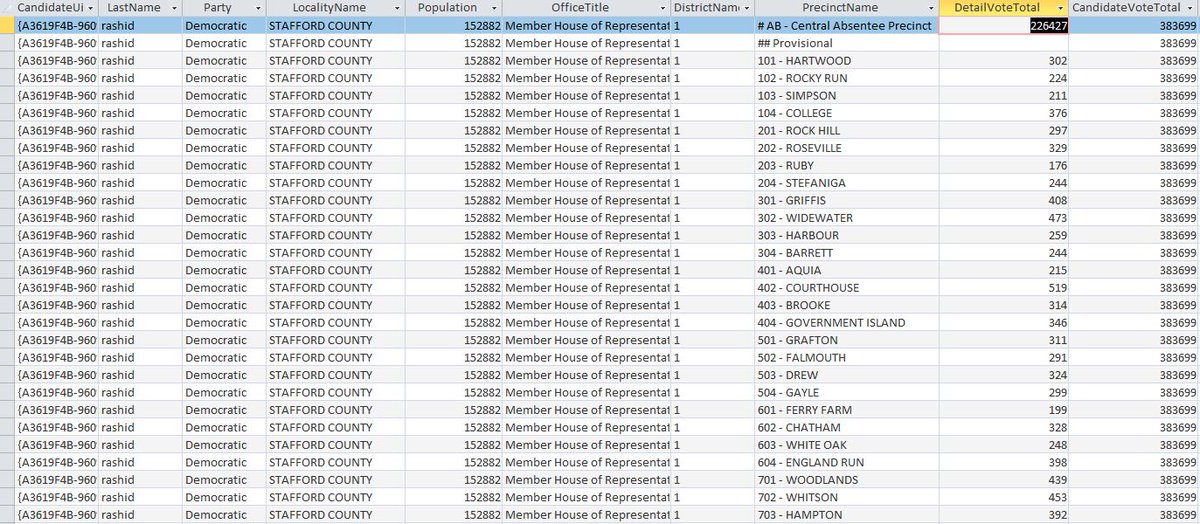
@ColdPotatoSpud @bedivere_knight @Peoples_Pundit The absentee ballots reported in the turnout file is bizzare (high), but is nothing close to what the raw data say are the absentee ballots associated with Rashid in Stafford County. See the details :