
Delighted to see our latest paper now available on biorxiv:
biorxiv.org/content/10.110…
In this study, we set out to solve the problem of SNP calling in bacterial pan-genomes. What problem, you say? .... 1/n
biorxiv.org/content/10.110…
In this study, we set out to solve the problem of SNP calling in bacterial pan-genomes. What problem, you say? .... 1/n
What problem, you say? Roughly speaking, given a set of bacterial genomes, there has been no way to detect all the SNPs between them, including accessory genes. We solve this. 

First i'll formulate the problem, give a long bioinformatic discussion, and at the end show some amazing figures/results for E coli. Feel free to skip to the figures 3/n
The problem is this. If you line up two human genomes, the alignable proportion will be 99% or something huge. So, you can go a long way mapping reads to the human reference, and doing SNP calling that way. Not so for bacteria, where that 99% figure could be just 50%. 4/n
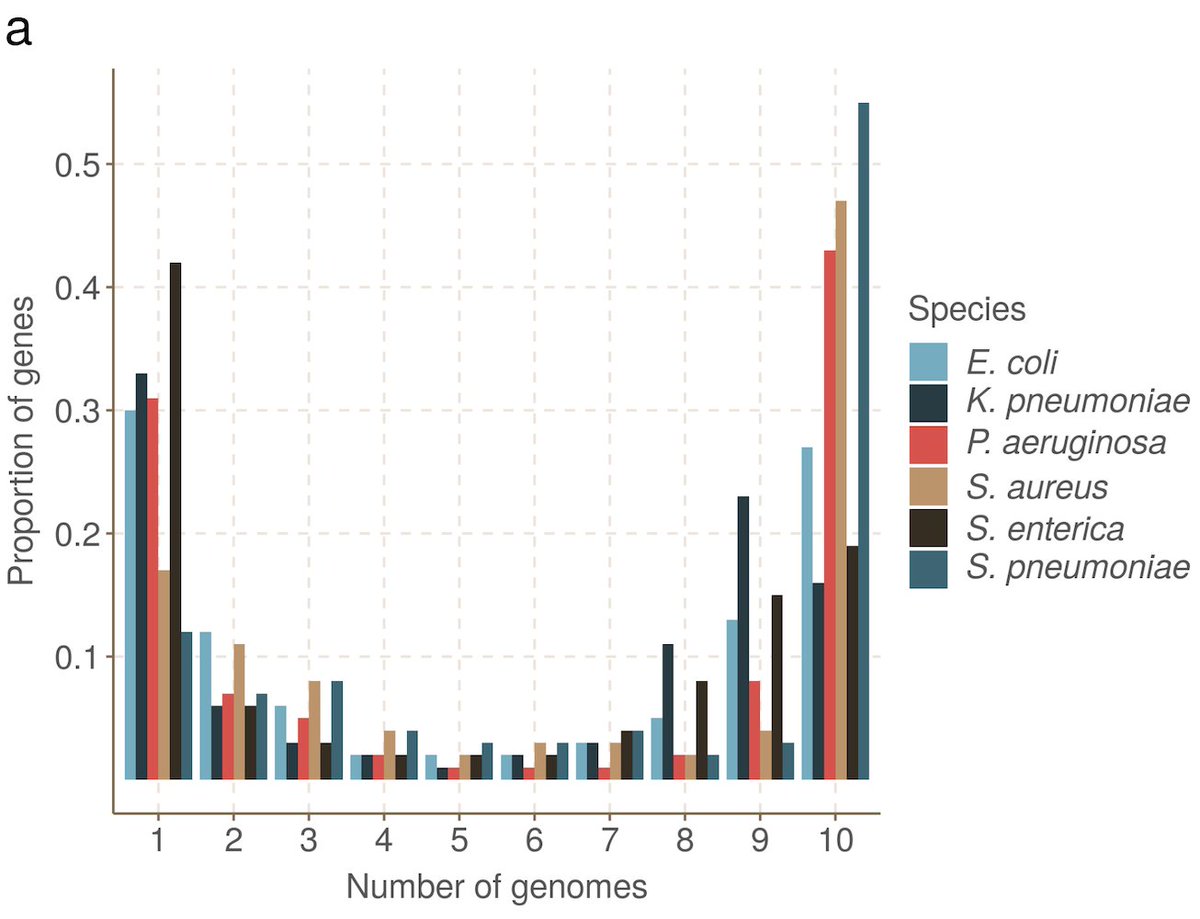
Bacterial genomes are gene-rich (>80%), and follow a universal U-shaped gene frequency distribution - genes tend to be rare or common. There's a core genome shared by most, and a pool or rare and transient genes moving in and out of the population. 5/n
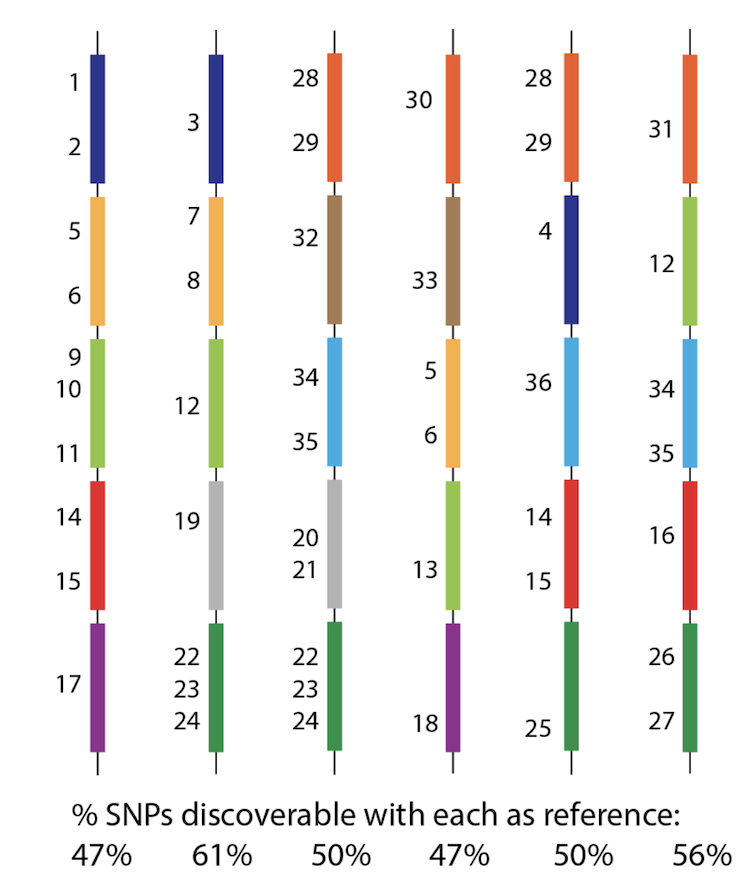
So - how can we possibly call SNPs in a situation like this? Whichever genome we use as reference will be missing many many genes, and therefore SNPs from the population? See this figure, with 36 SNPs, but no reference can see them all. 6/n
We call this HARD BIAS. Chunks of genome missing, so there is no way to give coordinates/position to a SNP. This is distinct from the usual reason for wanting graphs - SOFT bias, which is where it becomes harder to map/align reads as the sample+reference get more diverged. 6/n
So here's what we do. We decompose a pan-genome into genes and intergenic regions, and make "graphs" of each, built from multiple sequence alignments. Thanks @EpicFeil_ , Sion Bayliss, Ed Thorpe, @richardneher and others for help and discussions along the way. 7/n
(techie interlude)
For the experts, we do some key things here. First, we build a graph from an MSA with a recursive algorithm that maintains local linkage, and therefore avoids the blowup problems that many genome graph approaches suffer from 8/n
For the experts, we do some key things here. First, we build a graph from an MSA with a recursive algorithm that maintains local linkage, and therefore avoids the blowup problems that many genome graph approaches suffer from 8/n
Second, having built our (directed acyclic graph obeying a balanced parentheses condition), we index it with minimizers, and from then on work with a minimizer graph. 9/n
Third, we don't do alignment to the graph, which is painful and expensive, and isn't needed for what we want. Instead, we remember our basic population genetics.…. 10/n
We take a 2 step approximation. Step 1: approximate a genome as a recombinant of a reference panel. This is done by quasimapping reads to the graph, and then doing dynamic programming to infer a "mosaic approximation" - the nearest recombinant of the ref panel, to the sample 11/n
Step 2: well, the reference panel won't contain all the snps in the world, so my new sample will surely contain some SNPs that are not in my graph. We spot these as low coverage regions and fix up errors with local assembly. 12/n
I'm glossing over here some very clever algorithmics and implementation in the assembly - this all works for both nanopore and ilumina data - from @mbhall88 and @leandro_ishi - see the paper for the details. 13/n
Now comes a v interesting thing. How do we output our results? We'd like to use VCF, as thats what everyone uses, but VCF needs a reference genome. If you specify the reference up front, you immediately inherit hard bias! AFAIK all current graph genome tools suffer from this.14/n
What do we do? We infer a new reference genome specifically designed to allow us to "see" the variation between a cohort of samples as clearly as possible. See this figure: inb panel b, the black reference genome makes it hard to see the blue/red SNP; in panel c, it is easy 15/n

(end of tech interlude)
So we build a pan genome from genes and intergenic regions from about 500 E coli reference genomes. And then we collect 20 samples from across the tree, which have matched nanopore and illumina data, and curated long-read assemblies. 16/n
So we build a pan genome from genes and intergenic regions from about 500 E coli reference genomes. And then we collect 20 samples from across the tree, which have matched nanopore and illumina data, and curated long-read assemblies. 16/n
Here's our data (20 samples marked with dots on left hand vertical bar) spread across 4 E coli phylogroups. The other genomes are RefSeq reference genomes chosen to be closest to one of the samples. We use these for benchmarking single-ref callers

We said we wanted to find all SNPS between these 20 genomes - how do we evaluate? We do all pairwise alignments of the 20 truth genomes, and find SNPs between them. Then we needed to notice if a SNP between genomes 1,2 was the same as another SNP between genomes 3,4. 18/n
This deduplication is an exciting and computationally expensive side-track, and the interested reader is referred to our paper. At the end we have a set of true SNPs and know where they are in all the genomes. Each one is an equivalence class of genome/coordinate/allele's. 19/n
OK, so what do we find? Oh so many things...
100x ONT data . Y axis=recall, x axis is error rate. Left you have 2 curves for pandora (with/out local assembly). Recall is 85% & error rate 0.5%. To the right you see nanopolish, medaka with different ref genomes- higher error rates and lower recall dependent on choice of ref.

I'm not going to go into the details of that plot - see the paper. Also for illumina data, see the paper. Full disclosure for illumina - we have better recall and error rate than samtools, but snippy has a lower error rate than we do - we will have to improve!
OK, that was a long preamble. The goal of this was getting at accessory variation. Obviously this will be somewhat dependent on what reference panel we build our graph from (we used RefSeq). So, let's see the key figure:

Y axis is recall; every SNP is in a locus, X axis is how many samples that locus is in. Look on the left between the dotted line (pandora) and the box plots (samtools etc with different refs)! 1000s of rare SNPs that you cannot access with normal methods.
That is essentially why we've done this. See our paper of how building from a well sampled set of genomes would improve recall on the left. In fact, if you really care about a specific dataset, you could annotate and build a graph for that set - recall would then be ~100%
So let's focus for a minute on SNPs in loci that exist only in 2 genomes. 2-SNPs. Do those two loci tend to reside in the same E coli phylogroup? Here, no. Heatmap shows number of 2-snps shared between pairs of samples. identifiers coloured by phylotype.

Having a ref in the same phylogroup as your sample is an advantage. Each panel is results for Snippy using a fixed ref, each bar is recall for 1 sample. Background colour is phylogroup of the ref; colour of bar is phylogrp of sample. So pink ref does well for pink samples, etc
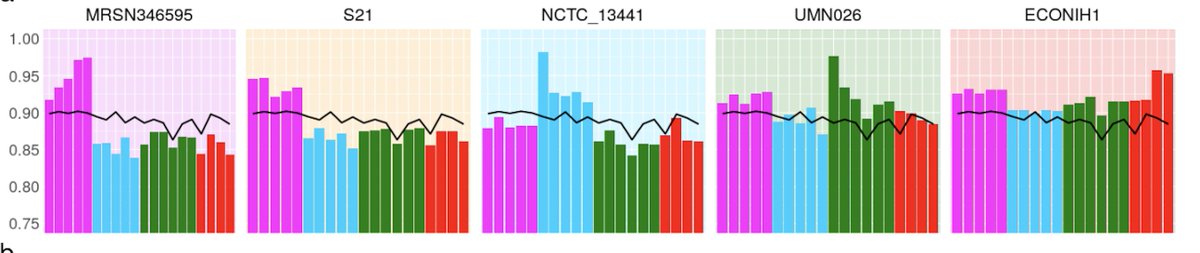
BUT, if we restrict to 2-SNPS (locus present only in 2 samples), we see this:
VERY different - basically all the refs do badly, and no real correlation between ref phylogroup and sample, whereas pandora does a lot better.
VERY different - basically all the refs do badly, and no real correlation between ref phylogroup and sample, whereas pandora does a lot better.

I mentioned that we infer a reference to make the multisample VCF as clear as poss. This shows how often the gene in a sample is < 1% edit distance (scaled by length) of the gene in the ref. LOG SCALE. Pandora's ref is close to the samples FAR more often than the 24 references.

Those are the highlights.Pandora is avail on github (github.com/rmcolq/pandora). It's not yet a production tool - 2 steps in the workflow need optimising. We use clustal-omega to MSA our loci, & our recursive graph construction algo is in python. We'll address in coming weeks
We show in our paper that the initial "mosaic approximation", which basically involves genotyping the graph without de novo discovery, is already a very good approximation. It's a bit like wgMLST but for genes and intergenics and allowing recombination. So....
If you just want to do that, then pandora is pretty fast and just needs a single command to run. If you want to do de novo assembly, find all the new snps, and loop back and put them into the graph, and re-run, which is the full workflow...
...that is currently slowed by the MSA/python described above and you need to run on a cluster. We have a list of things to do which will address this. But for right now, we maybe might just take a breather.
attaching end of thread!
https://twitter.com/ZaminIqbal/status/1327134512862679043?s=20
• • •
Missing some Tweet in this thread? You can try to
force a refresh


