This is just cruel.

#Iota is the 30th named Tropical Storm and is expected to become a major Hurricane by early next week

Iota is heading for Central America, likely to hit communities still trying to recover from Hurricane Eta which struck only a few days ago.

THREAD
#Iota is the 30th named storm of this record breaking hurricane season. Winds will be violent but attention quickly turns to flooding potential, again.

Major landfall is looking likely early next week. Honduras 🇭🇳and Nicaragua 🇳🇮 in the immediate firing line.
The track of hurricane #Eta is first image and latest forecast for #Iota from @NHC_Atlantic is the second image.

It is important to note that there is still track and intensity uncertainty and it is crucial to follow official forecasts at nhc.noaa.gov ImageImage
This was the rainfall forecast for #ETA earlier this month.

Some striking similarities.

• • •

Missing some Tweet in this thread? You can try to force a refresh
 

Keep Current with Scott From Scotland

Scott From Scotland Profile picture

Stay in touch and get notified when new unrolls are available from this author!

Read all threads

This Thread may be Removed Anytime!

PDF

Twitter may remove this content at anytime! Save it as PDF for later use!

Try unrolling a thread yourself!

how to unroll video
  1. Follow @ThreadReaderApp to mention us!

  2. From a Twitter thread mention us with a keyword "unroll"
@threadreaderapp unroll

Practice here first or read more on our help page!

More from @ScottDuncanWX

16 Nov
5 years in a row of category 5 hurricanes. This has not happened in recorded history going back to 1851.

#Iota is about to make landfall as a powerful category 5 storm. Nicaragua and Honduras can't take another major hurricane. It was only 2 weeks since category 4 #Eta.
The track of #Eta overlaid projected landfall of #Iota is insane. Two major hurricanes within a fortnight in November. Eta struck Nicaragua on 3 November.

Check out this comparison by @WeatherProf.

Heartbreaking.

Here are some of the beasts from the last 5 years.

Read 4 tweets
1 Nov
Extremely violent thunderstorm in Brisbane, Australia 🇦🇺 delivered enormous #hailstones.

Catastrophic damage costing over $50 million.

Short thread...

This is insane. From Brisbane 🇦🇺

One of the worst #hail storms this decade.

Some aerial footage of the damage.

While extremely dangerous, this is a nightmare for insurance.

#brisbane #hail

Read 5 tweets
1 Nov
This is the sound of one of the strongest storms ever witnessed on Planet Earth.

This is super typhoon #RollyPH
(#Goni) striking Albay, Philippines 🇵🇭 a few hours ago.

A historic event.

Super typhoon #RollyPH /#Goni moving over land near Ligao, Albay (Philippines) 🇵🇭

Video: Eric Lozada

#RollyPH

The winds of #RollyPH are destructive but the flood waters can often be underestimated. Polangui, Albay. Magurang area, Philippines 🇵🇭 at around 10am local time.

Video: Lea Salalima

Read 5 tweets
31 Oct
⚠️ Destruction in the Phillippines 🇵🇭 is inevitable with catastrophic landfall expected in the next 24 hours ⚠️

Super #Typhoon Goni is the strongest storm on the planet right now.

The centre of the storm will pass almost directly over the capital, Manila.
Category 5 hurricane equivalent as #Goni approaches.

Wave height reports of 60 feet (18 m) right now offshore.
Official warning tracks and graphics are here: metoc.navy.mil/jtwc/jtwc.html
Read 5 tweets
30 Oct
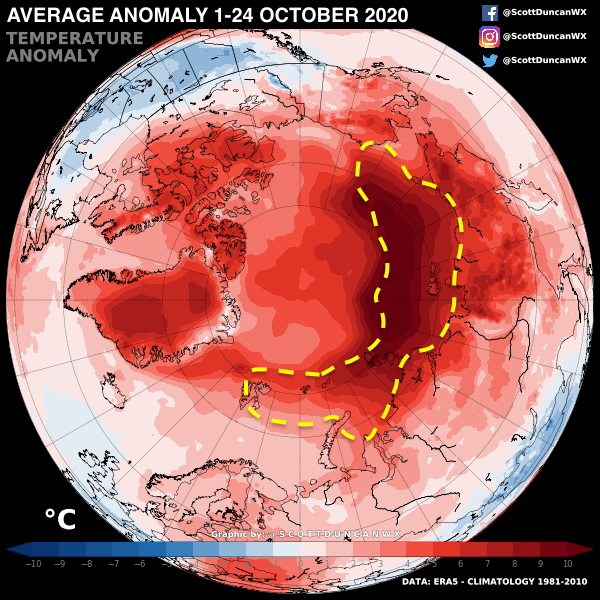
While large parts of the Arctic remain ice free, temperatures remain extremely high compared to normal for this time of year.

Temperature is unable to drop much below freezing where open water remains. In the past, ice cover would allow temperatures to be more like -25 °C.
We are observing the vicious loop which amplifies climate change in the Arctic.

Warmer Arctic = more ice melt = more open water = more energy absorbed from sun in summer = warmer water = more ice melt = more open water...
More on the Arctic sea ice trends in a thread here 👇

Read 4 tweets
29 Oct
Extreme and relentless heat in the Arctic has resulted in a shocking lack of Arctic Sea Ice this year.

The refreeze season is millions of square kilometres behind where it should be (orange line). We are in uncharted territory right now.

This is daily coverage since April.
More and more water becomes exposed each decade as the climate warms.

This is how the minimum ice extent varies from 1980 to 2020.

The orange line is a 30 year average from 1980-2010 for this date.
If we average each dace since the 1980s, the trend is clear.
Read 5 tweets

Did Thread Reader help you today?

Support us! We are indie developers!


This site is made by just two indie developers on a laptop doing marketing, support and development! Read more about the story.

Become a Premium Member ($3/month or $30/year) and get exclusive features!

Become Premium

Too expensive? Make a small donation by buying us coffee ($5) or help with server cost ($10)

Donate via Paypal Become our Patreon

Thank you for your support!

Follow Us on Twitter!