
How I use multi time frame trading setup based on simple Support and resistance?
@ArjunB9591 @TradingMonk_UJ Re-tweet for max learning.
@ArjunB9591 @TradingMonk_UJ Re-tweet for max learning.
Multi TF trading setup consists of one TF for analysis and one TF for entry/exit.
✅ Price Action rules tells us that higher the TF, better the reliability of important price zones.
✅But, PA rules also tells us that big moves begin on smaller TFs.
✅ Price Action rules tells us that higher the TF, better the reliability of important price zones.
✅But, PA rules also tells us that big moves begin on smaller TFs.
Multi TF trading setup combines the best of both.
✅ Higher TF for marking important price levels.
✅ "Lower TF sustained entry/exit" to time the best entry/exit.
✅ Higher TF for marking important price levels.
✅ "Lower TF sustained entry/exit" to time the best entry/exit.
Titan 30 mins chart:
✅ Resistance and support marked.
✅Movement of price along with increased volume - sign of a STRONG MOVE.
✅ Price reaches resistance band.
✅ Resistance and support marked.
✅Movement of price along with increased volume - sign of a STRONG MOVE.
✅ Price reaches resistance band.

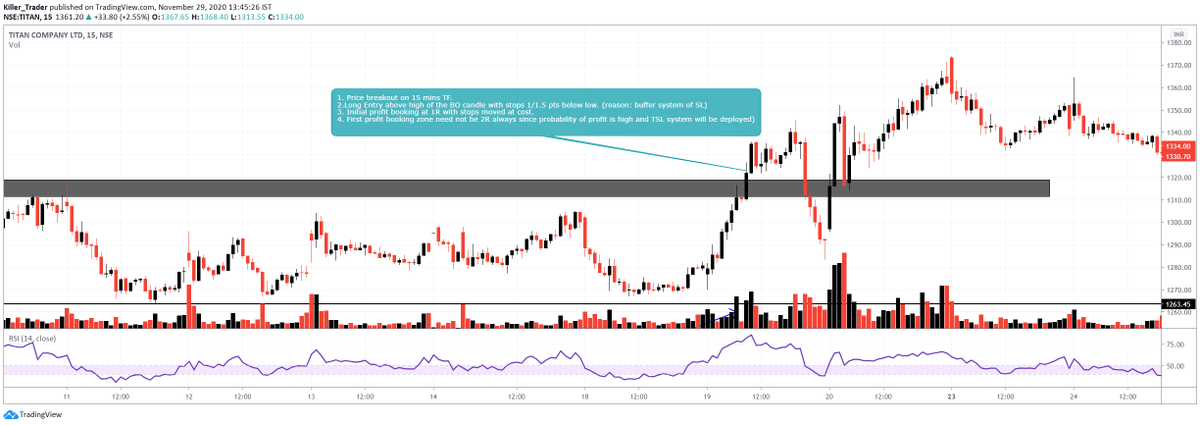
Titan 15 mins chart:
✅ Entry at 1327 with SL at 1309. 1R is initial profit booking area with SL moved at cost. 18 pts gain achieved.
✅ Refer below chart for detailed explanation.
✅ Entry at 1327 with SL at 1309. 1R is initial profit booking area with SL moved at cost. 18 pts gain achieved.
✅ Refer below chart for detailed explanation.
Important Pointers:
✅ Setup is simple, can be followed for both long and short trades.
✅ Higher accuracy and bigger targets can be achieved following 1 simple rule: Follow the trend.
✅ Follow trend doesn't only mean stock trend but also broader market trend.
✅ Setup is simple, can be followed for both long and short trades.
✅ Higher accuracy and bigger targets can be achieved following 1 simple rule: Follow the trend.
✅ Follow trend doesn't only mean stock trend but also broader market trend.
✅ If Nifty is going up, focus more on Long setups.
✅ If Nifty is falling, focus more on short setups.
✅✅NEXT THREAD: How to base trading decisions on market volatility!
Comments/queries welcome.
✅ If Nifty is falling, focus more on short setups.
✅✅NEXT THREAD: How to base trading decisions on market volatility!
Comments/queries welcome.
• • •
Missing some Tweet in this thread? You can try to
force a refresh


