
Our latest report - 'Confronting Carbon Inequality in the EU: Why the European Green Deal must tackle inequality while cutting emissions' is here: oxfam.org/en/research/co… It builds on our earlier work with @SEIclimate using the same dataset. Here's a thread with the key findings
The EU as a whole was responsible for 15% of global cumulative consumption emissions 1990-2015, but the responsibility was not equally shared among EU citizens. Richest 10% = over 1/4 of the total = about the same as the poorest 50% of Europeans combined 
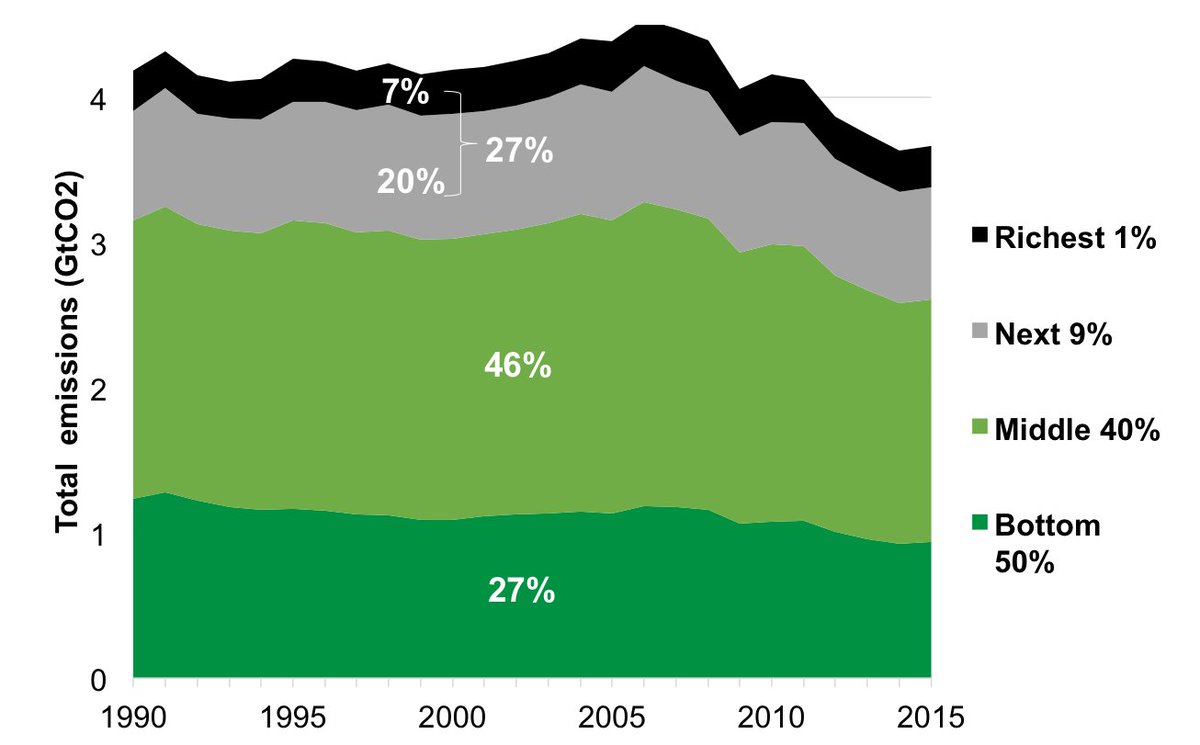
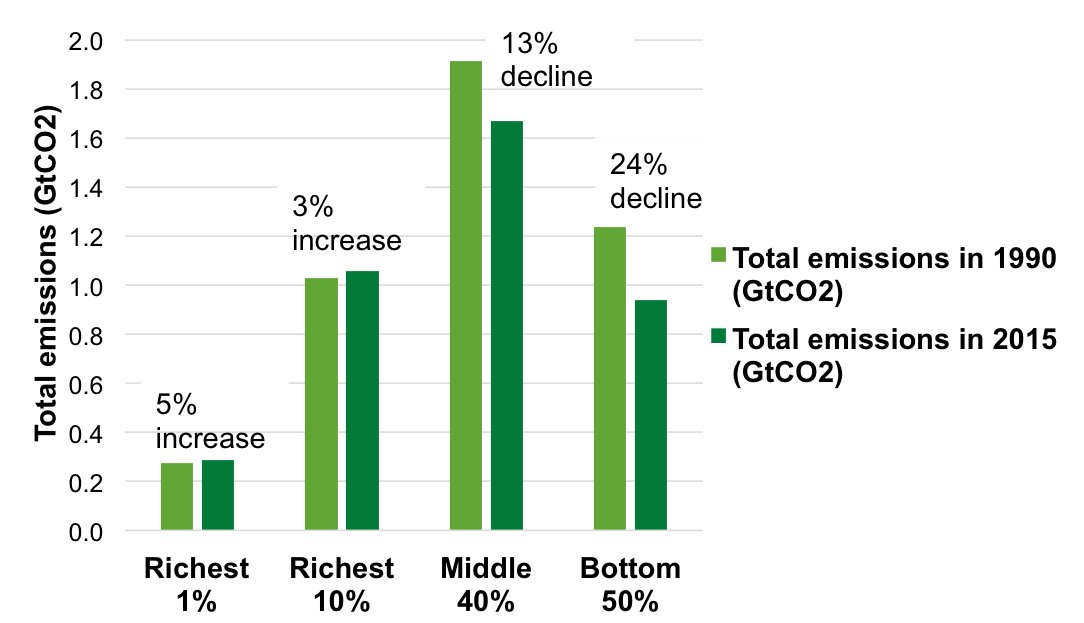
EU consumption emissions fell c. 12% 1990-2015, but these cuts weren't equally shared among EU citizens. Emissions of poorest 50% fell 24%, those on middle incomes fell by 13%, while those of richest 10% actually INCREASED by 3% (and of richest 1% by 5%).
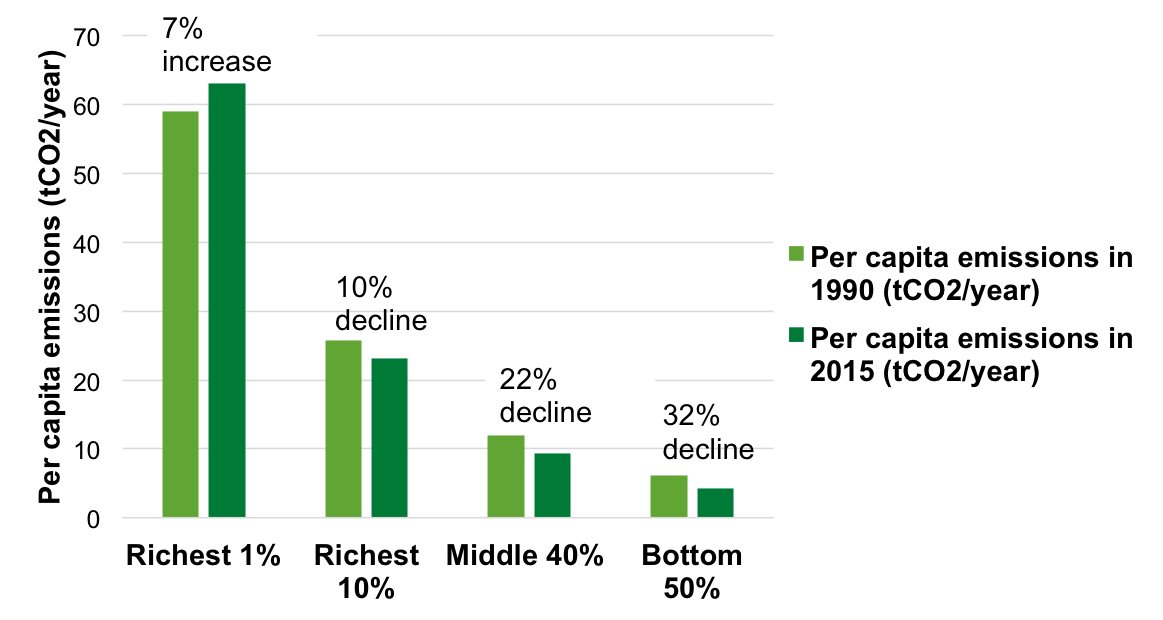
On a per capita basis this translates into declines of 32% among the poorest 50%, and 22% among those on middle incomes. Due to a growing population, the per capita emissions of the richest 10% also fell, but only slightly, while those of the richest 1% grew by 7%!
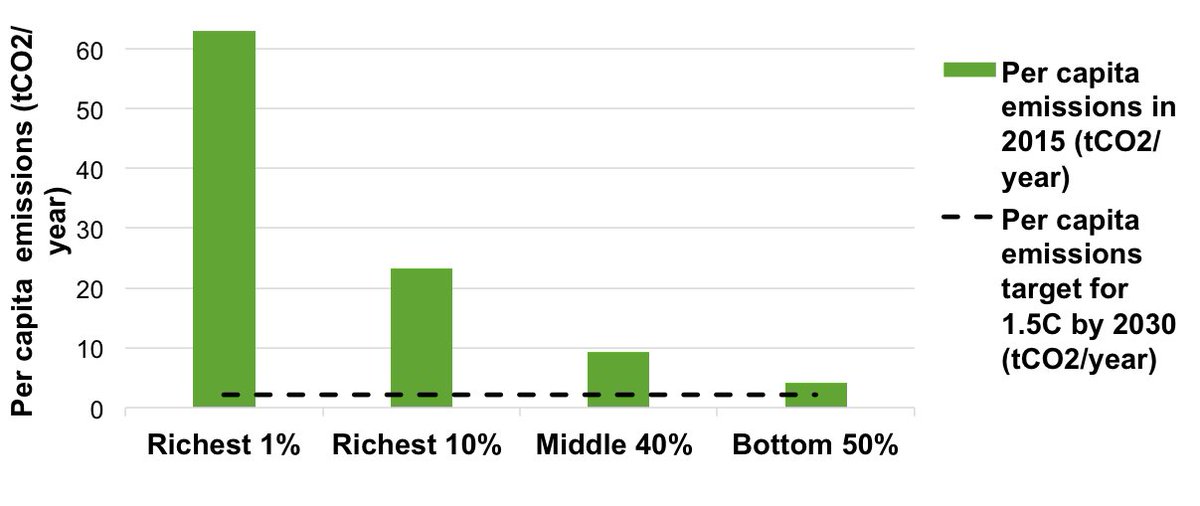
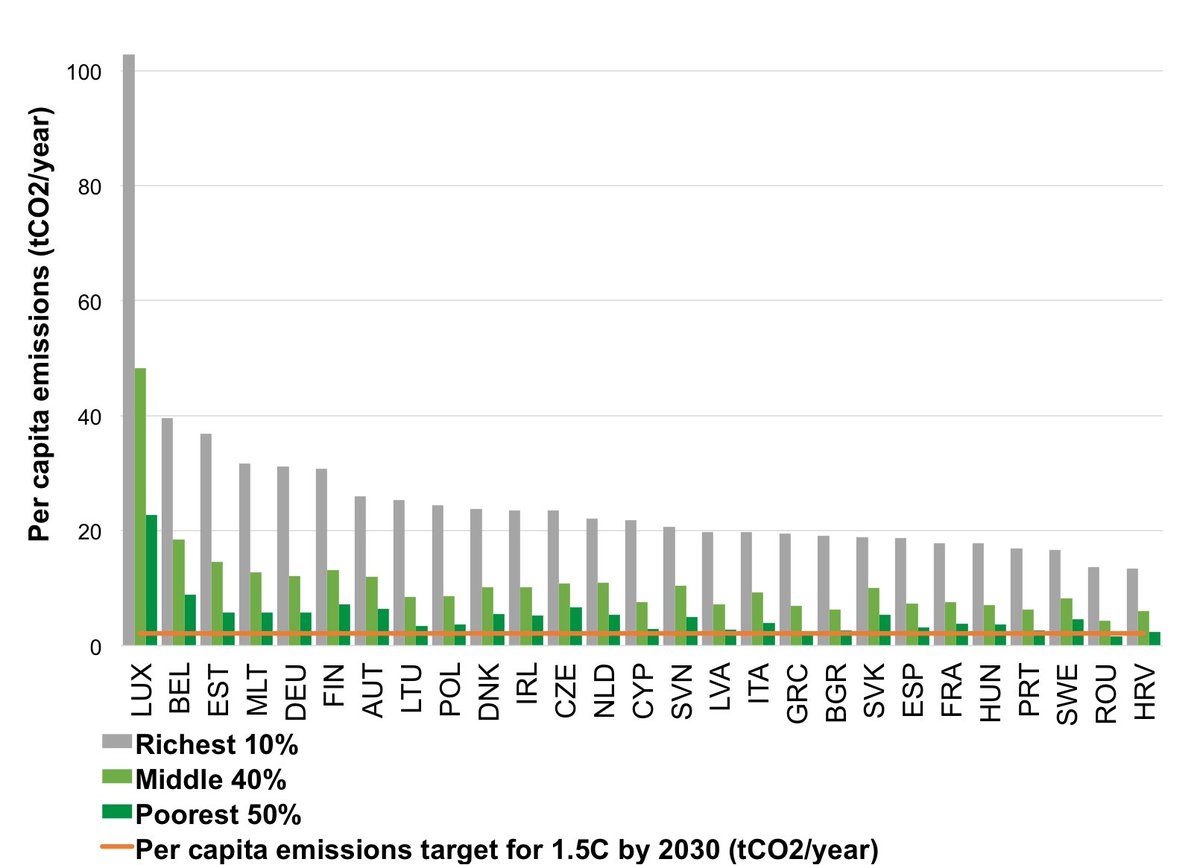
Looking ahead, we estimate global per capita emissions need to be 2.1tCO2/yr by 2030 for a 1.5C pathway. Per capita emissions of richest 10% in EU need to fall 10x in next 10 years, & those of richest 1% by 30x. Emissions of poorest half of Europeans need 2 be halved.
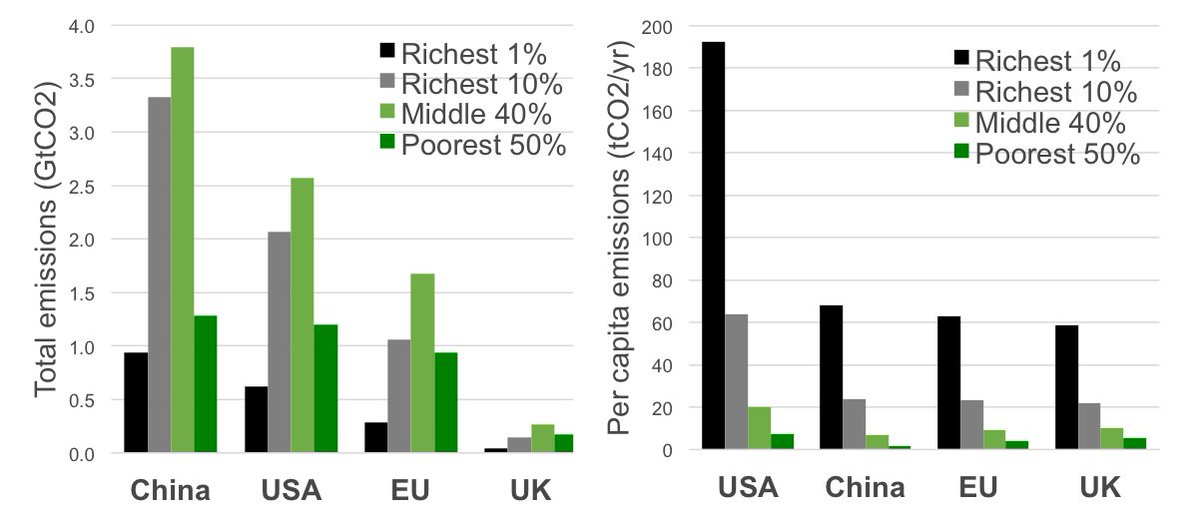
How do EU rich/poor compare to rich/poor in other countries? Richest 10% in China = more in absolute terms than EU total. But 10% richest in China, EU, UK = similar per capita. Poorest 50% in China = far lower than poor in EU/UK. Richest 10% in US = 2x the richest in EU/China/UK
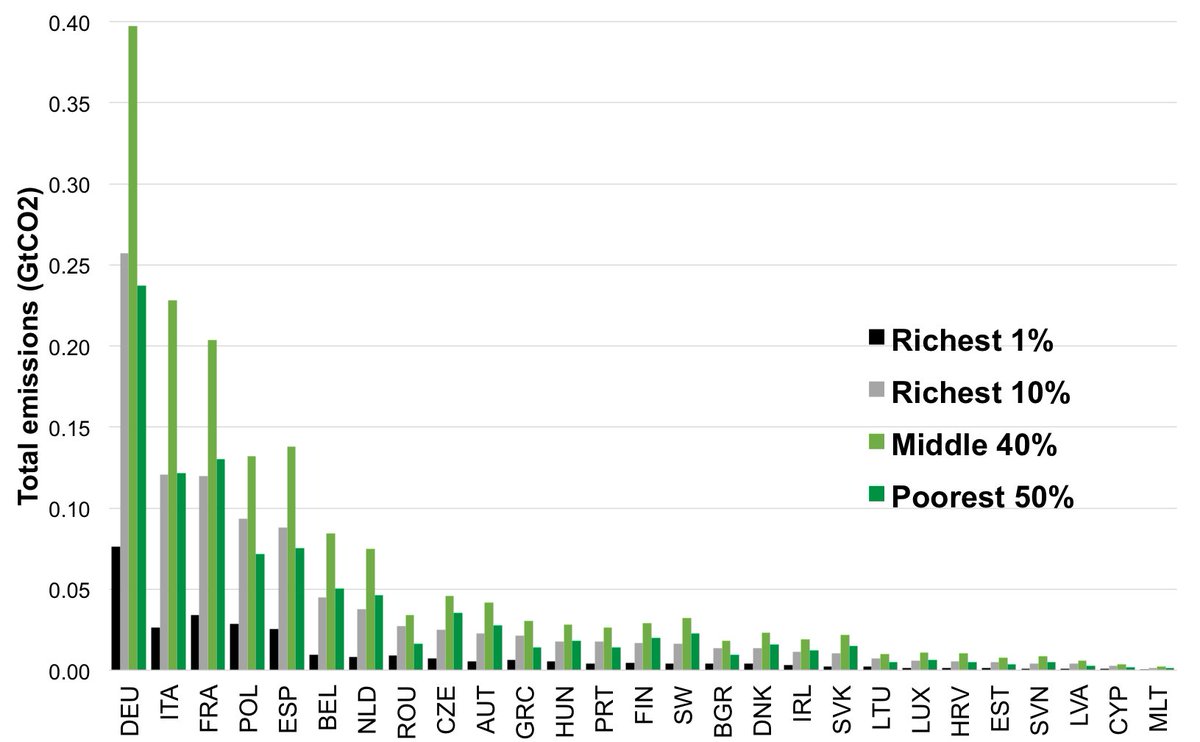
Carbon inequality = stark both between and within MSs. In absolute terms, biggest contributors are richest 10% in rich, populous MSs. But richest 10% in Poland = more than total emissions of Swe or Hu. And richest in smaller MSs like Be & Nl also have an outsized contribution
In per capita terms, highest emitters are richest in Lux, Be, Est, Mlt. Richest in countries like Swe, Prt, Fr or Esp relatively low compared to richest elsewhere - shows it is poss to cut at top - though even their footprints are still 8 or 9 times higher than needed by 2030
What does all this mean? EU emissions cuts since 1990 happened at the same time that income inequality worsened across Europe (see wid.world/document/bcg20…). Carbon intensity gains were not sufficient to offset the increased incomes/consumption of richest...
... But to hit the much deeper 2030 emissions cuts needed in EU (as everywhere), the richest can't continue to have a free ride. The European Green Deal should be used to fight inequality while cutting emissions...
...We give examples of what that can look like, from Energy Taxation Dir, Perf Stds for Cars Regn, Renovation Wave etc + MS action on eg wealth taxes: Policies that cut emissions of richest while benefiting lower income households, & lay the foundation 4 COVID-19 recovery. ENDS
.@JKSteinberger @jasonhickel @KateRaworth @KevinClimate @diana_nbd @KarthaSivan @beth_stratford @pbloomer @lucas_chancel @holmjens @IEEP_eu @CANEurope @edking_I @TimmonsRoberts @TimmermansEU @pcanfin @EUClimateAction @SkaKeller @StefanGossling
• • •
Missing some Tweet in this thread? You can try to
force a refresh


