THREAD: Is the Govt changing its cherrypicking strategy on child poverty claims?
SPOT THE DIFFERENCE
1. What PM wrongly claimed on child poverty in 2019, earning @StatsRegulation rebuke
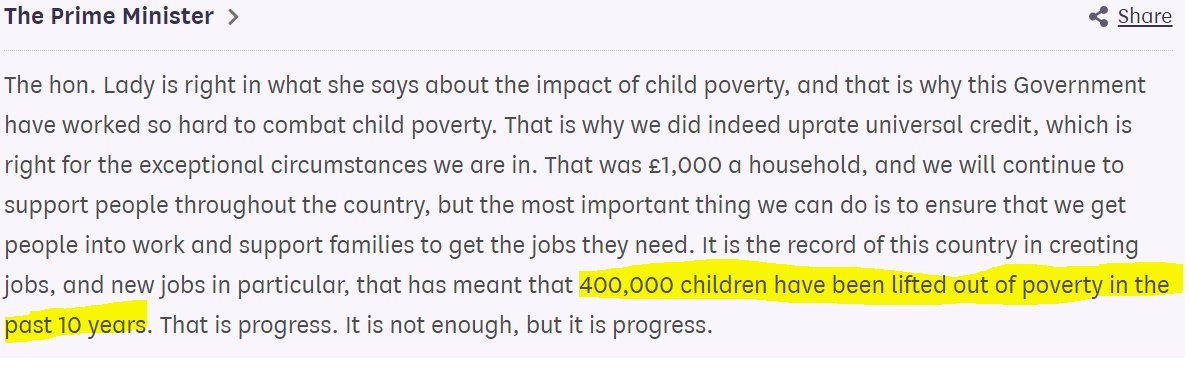
2. What PM claimed on child poverty at PMQs on 18 Nov 20
SPOT THE DIFFERENCE
1. What PM wrongly claimed on child poverty in 2019, earning @StatsRegulation rebuke
2. What PM claimed on child poverty at PMQs on 18 Nov 20
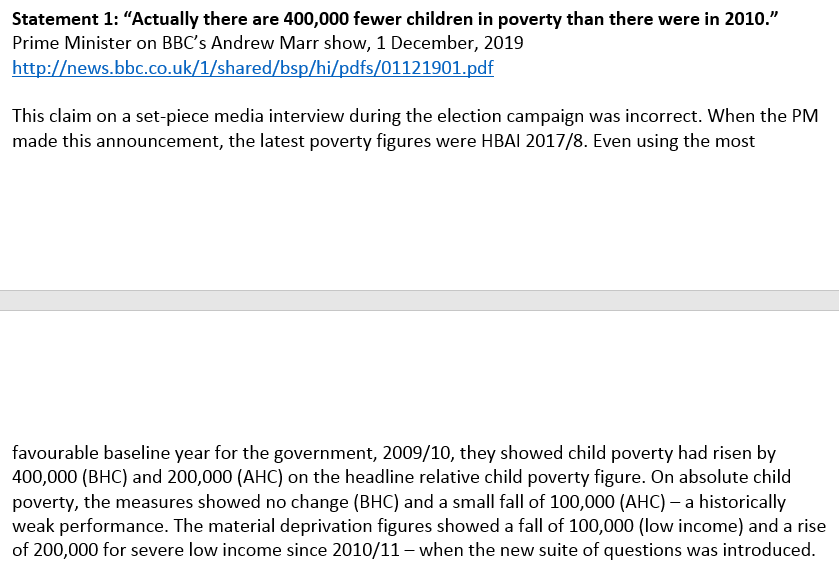
In the first statement, the PM used 2010 as a baseline. At the time, relative poverty was rising and absolute poverty was historically weak - we could not see where the 400,000 claim had come from.
An earlier thread on the PM's past claims
An earlier thread on the PM's past claims
https://twitter.com/imran_1/status/1288791490702061568?s=20
In the PMQs claim he talks about the last 10 yrs.
If he means since 2010, he'd be repeating his incorrect claim.
Does he mean the last 10 years for which we have statistics?
That would be starting at 2009/10 - under LAB & well before benefit cuts started to bite from 2012
If he means since 2010, he'd be repeating his incorrect claim.
Does he mean the last 10 years for which we have statistics?
That would be starting at 2009/10 - under LAB & well before benefit cuts started to bite from 2012
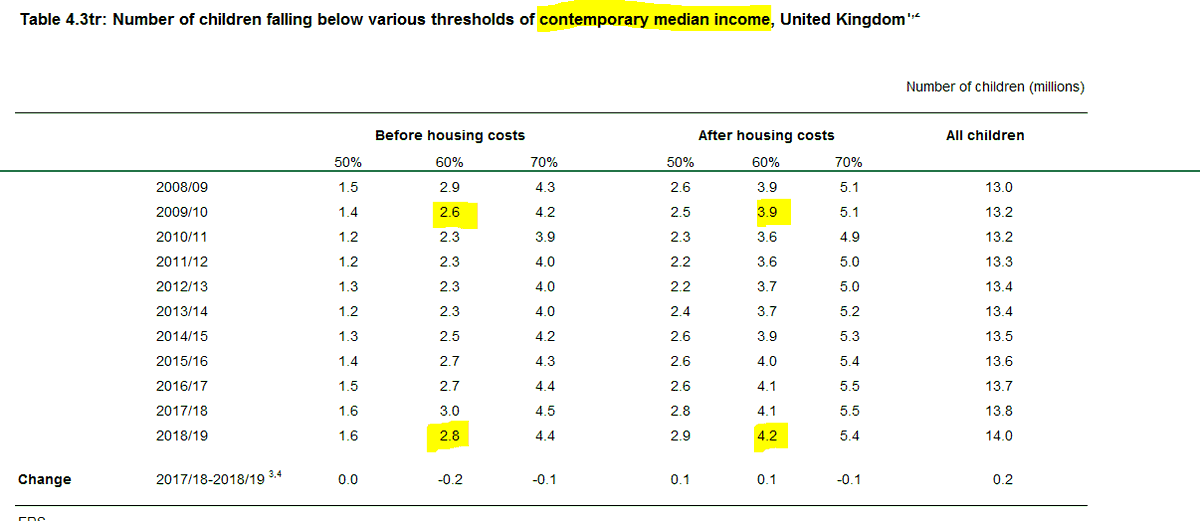
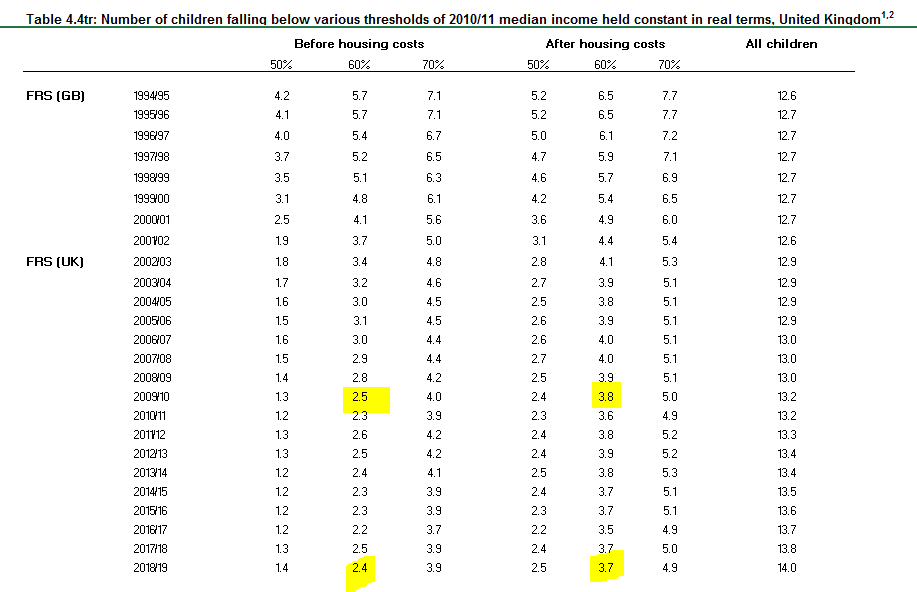
Let's take a look, first, at the relative child poverty measure
Looking at the last 10 years, child poverty has RISEN by 200,000 (BHC) or 300,000 (BHC)
Looking at the last 10 years, child poverty has RISEN by 200,000 (BHC) or 300,000 (BHC)
Can the PM's 400,000 claim be borne out by the absolute child poverty stats? Remember, we normally expect this figure to fall, as society gets richer
No, absolute child poverty fell by 100,000 on both BHC/AHC - a historically weak performance
No, absolute child poverty fell by 100,000 on both BHC/AHC - a historically weak performance
Can the PM's claim to have cut child poverty by 400,000 be from the material deprivation measures?
No - because the new suite of measures goes back 9, not 10 yrs
No - we've seen a small fall on one measure and a small rise on the other
No - because the new suite of measures goes back 9, not 10 yrs
No - we've seen a small fall on one measure and a small rise on the other

So, where is the 400,000 figure from?
The closest the PM can come to that would be if his baseline was even earlier and focused only on the BHC absolute poverty measure
The closest the PM can come to that would be if his baseline was even earlier and focused only on the BHC absolute poverty measure

But this throws up some quirks/problems:
1. 2008/09 is obviously going back 11 yrs, not 10 yrs. So the PM's statement was inaccurate.
2. This would be only apply to the BHC absolute measure. There was a 300,000 RISE on the AHC relative measure in the same period
1. 2008/09 is obviously going back 11 yrs, not 10 yrs. So the PM's statement was inaccurate.
2. This would be only apply to the BHC absolute measure. There was a 300,000 RISE on the AHC relative measure in the same period
3. Significantly, it appears Govt has changed its strategy of claiming poverty reductions by cherrypicking statistics for the years since 2010
The cherrypicking strategy was something I raised with @StatsRegulation 3 yrs ago & got a sympathetic response uksa.statisticsauthority.gov.uk/wp-content/upl…
The cherrypicking strategy was something I raised with @StatsRegulation 3 yrs ago & got a sympathetic response uksa.statisticsauthority.gov.uk/wp-content/upl…
It appears the Govt is now cherrypicking which years it uses for its child poverty claims
The record after 2010 is so poor, it seems it is reaching back as far 2008.
Including that year under Gordon Brown seems to give the PM 300,000 of his 400,000 claim.
The record after 2010 is so poor, it seems it is reaching back as far 2008.
Including that year under Gordon Brown seems to give the PM 300,000 of his 400,000 claim.
To recap, I don't know for certain where the 400,000 claim comes from, but it seems to be from the BHC absolute measure over 11 years.
If that's true, then I'd urge Govt to spend more time on actually tackling rising child poverty than creative ways to hide that reality
ENDS
If that's true, then I'd urge Govt to spend more time on actually tackling rising child poverty than creative ways to hide that reality
ENDS
@threadreaderapp unroll
• • •
Missing some Tweet in this thread? You can try to
force a refresh