

1/51 At Stage 1 of your trading journey, a stage we call as “Learning to Trade“, one of the very first things you’ll get exposed to as a technical trader, are charts & honestly, a lot of them!
2/51 Don’t get too caught up with old-school stuff
Conventional technical analysis talks a lot about stuff like “Support”, “Resistance”, “Break out”, “Break down” etc.. So, chances are that you already at-least have a basic idea about these.
Conventional technical analysis talks a lot about stuff like “Support”, “Resistance”, “Break out”, “Break down” etc.. So, chances are that you already at-least have a basic idea about these.
3/51 If not, just Google the terms and you’ll find a ton of material explaining you all that (agreeably, most of which is absolute garbage!!).
So, I ‘ll quickly summarize in very short, what these are.
So, I ‘ll quickly summarize in very short, what these are.
4/51 Support & Resistance: Supports & Resistance levels aren’t IRON WALLS, like most amateur traders mistake them to be. They are merely some ZONES (not precise price levels) where we can expect the price behavior to be a little less random than normal.
5/51 If this statement was too hard for you to digest, don’t worry, you'll get better as you grow as a trader & you'll know exactly what I am talking about.
6/51 Breakout and Breakdown: When the price of an instrument crosses over a resistance, it is called as a breakout & when the price crosses under a support, it is called as a breakdown. Most breakouts & breakdowns fail.
7/51 Also, there is no definitive way of knowing if the break will sustain or fail, while it is happening. You will you be able to judge in hindsight analysis, which of the breaks failed miserably, and which ones sustained.
8/51 Though there ARE ways you can (sort of) judge the chances of a break being a successful one, but again, they are just probabilities, not certainties.
9/51 So, the point that I am trying to get across is that supports, resistances, breakouts & breakdowns are not a complex riddle, and neither should you try to make them into one. The trick really is to not get too hung up on them!
10/51 Whatever way you find yourself gravitating or whichever form of support / resistance you chose to use, the most important thing is to be consistent with your approach. That is how you will start to build market sense or intuition around what you use.
11/51 What do I personally see on a chart?
My idea around support & resistance is pretty simple. For me, if its not visible to the naked eye, its probably nothing. One of the most clearly visible support / resistance points on a chart are previous pivots.
My idea around support & resistance is pretty simple. For me, if its not visible to the naked eye, its probably nothing. One of the most clearly visible support / resistance points on a chart are previous pivots.
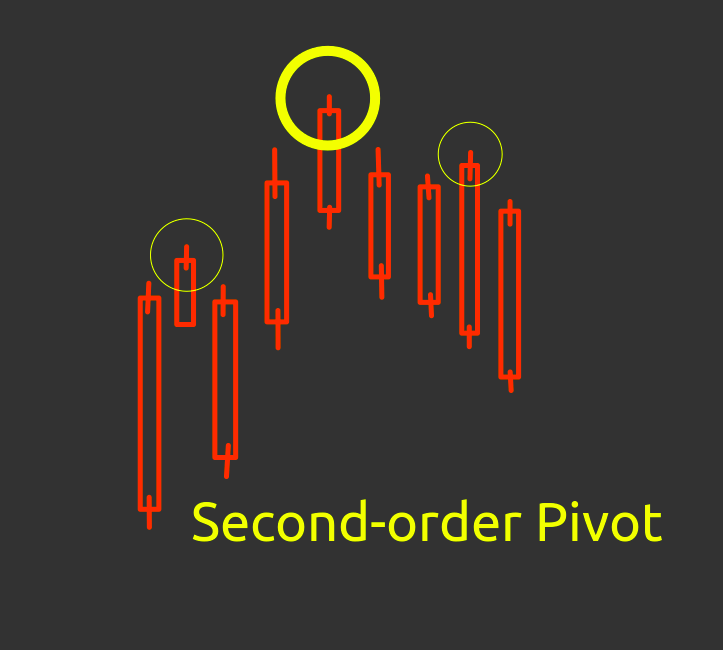
12/51 A pivot-high is a bar that has a higher high than both – the bar before it & the bar after it. Similarly, a pivot-low is a bar that has a lower low than the bar before it & the bar after it. These are also called as first-order pivots.
13/51 These pivot points are so common on a price chart that they are rarely of much significance.
When a pivot itself is preceded & succeed by another first-order pivot, these are called as second-order pivots.
When a pivot itself is preceded & succeed by another first-order pivot, these are called as second-order pivots.
14/51 Which means lower first-order pivot highs on both sides are required for a second-order pivot high & higher first-order pivot lows are required on both sides for a second-order pivot low.
15/51 Agreeably, these points hold much more significance than first-order pivots in general.
As we extend the same concept further, we get to third-order pivots.
As we extend the same concept further, we get to third-order pivots.
16/51 As you will see on a price chart, these points mark the most important market structures & turn out to be very significant turning points in market direction. 


17/51 Ok! I’ll get rich pretty fast if I simply sell on a third-order pivot high & buy on a third-order pivot low. Right?
Well sadly, NO! One thing to remember is that no one can know whether a point on a price chart will convert into a higher order pivot or just be nothing.
Well sadly, NO! One thing to remember is that no one can know whether a point on a price chart will convert into a higher order pivot or just be nothing.
18/51 All this analysis happens in hindsight. Which means you would not be able to identify these while its happening. But as you begin to train your eyes on intuitively finding them on a chart, you’ll get better at understanding the overall market structure.
19/51 Whatever way you find yourself gravitating towards or whichever form of support / resistance you chose to use or not use, it really doesn’t matter that much. Much more important is to be consistent with you see or don’t see on a chart.
20/51 That’s what will eventually get you good at chart analysis.
Getting consistent with what/how you see i.e. Standardize your charts.
Standardize absolutely all charts you see, right till the minutest of details.
Getting consistent with what/how you see i.e. Standardize your charts.
Standardize absolutely all charts you see, right till the minutest of details.
21/51 For example, no matter what chart I am seeing – whether global indices, commodities, Indian indices or Indian stocks.
22/51 All my charts
- Have the same layout
- Have the same same aspect ratio
- Are auto-scaled
If that sounded incredibly complex to you, don’t worry, its really simple in practice.
- Have the same layout
- Have the same same aspect ratio
- Are auto-scaled
If that sounded incredibly complex to you, don’t worry, its really simple in practice.
23/51 If you use TradingView charts (I do!), simply right click on the price axis & click on reset scale, OR alternatively, hit Alt+R. This will reset all manual alterations you might have done to the zoom and position of your chart.
24/51 Call me finicky, but even my browser windows are the exact same zoom level and ALWAYS full-screen. Most discount brokers (Zerodha, Fyers etc.) use charts from TradingView. So, you should be able to do this on their charts too.
25/51 Even if you use a desktop platform for charting, this “scale reset” option should either be the default setting or pretty easy to find.
26/51 Now, chances are that you might already be using the default scale, but if you don’t, and you’re someone who manually scales them in or out, just beware about these –
27/51 A. You make chart reading harder than it has to be & you’ve got to continually adjust your chart.
B. You potentially miss volatility changes, strong momentum (or the lack of it) & a lot of other things that come naturally with a price chart.
B. You potentially miss volatility changes, strong momentum (or the lack of it) & a lot of other things that come naturally with a price chart.
28/51 Always remember, chart reading is at-least as much of an art as a science, if not more.
29/51 Art on the chart
Now, let’s talk a little about Art on the chart. I have often seen traders get obsessed with drawing on the charts.
Now, let’s talk a little about Art on the chart. I have often seen traders get obsessed with drawing on the charts.
30/51 These obsessions range from different kind of lines, angles, arcs, weird geometric shapes, to relationships to full fledged mythological symbols. The thing is that we, humans, are arguably the best pattern recognition machines on the planet.
31/51 Try staring even at a bunch of clouds, and you WILL start to see different shapes, figures & faces emerge. I mean don’t get me wrong, I am not saying that drawing stuff on the chart is all bad, its not. In fact its a pretty powerful way to analyse price action.
32/51 Especially, initially in your trading. But think of chart art as balance wheels supporting you while you learn to ride your first bicycle. The important thing is to not get obsessed with finding and drawing some magical lines on your chart.
33/51 Trying to find some mystical force that you believe controls all price action! Those things just do not exist. If you are headed in the right direction as a trader, pretty soon, once you really get used to looking at charts, you wont need those balance wheels anymore.
34/51 Your eyes will most probably do a much better job without that art blocking the actual chart.
Personally, I like to keep my charts as clean as possible with no art whatsoever.
Personally, I like to keep my charts as clean as possible with no art whatsoever.
35/51 Indicators – Quant art on the chart
Ok, now lets talk a little about indicators or quantitative tools. Indicators are another form of chart art. They are basically math driven art on the chart. Needless to say, try and keep them to a minimal.
Ok, now lets talk a little about indicators or quantitative tools. Indicators are another form of chart art. They are basically math driven art on the chart. Needless to say, try and keep them to a minimal.
36/51 If you don’t have a good reason to have something on your chart, just DELETE it.
Before we get into any quant tools, be clear on one thing. Before applying a quant tool on your chart, you should know the exact mathematical calculations that go into it.
Before we get into any quant tools, be clear on one thing. Before applying a quant tool on your chart, you should know the exact mathematical calculations that go into it.
37/51 You should know very well, what your quant tool means mathematically & you should be able to calculate it with a calculator on a plain piece of paper.
38/51 The worst thing you can do to yourself is go nuts with “indicator shopping” & eventually get overloaded & tire yourself out in the process.
Moving on, the only quant tool I have on all my charts is a Keltner channel with a look-back of 20-bars and a multiplier of 2.25.
Moving on, the only quant tool I have on all my charts is a Keltner channel with a look-back of 20-bars and a multiplier of 2.25.
39/51 If you don’t know already, Keltner channels are volatility adjusted bands that use a combination exponential moving average and avg true range of a market to draw an envelope that typically would contain most of the price movement of that market.
40/51 Again, this is not some magical indicator and my values for look-back and multiplier aren’t by any means, special. They are just well thought of, and suit my style and requirements, that’s it.
41/51 I will do a detailed post or a video soon on Keltner channels explaining their basic math and my own quantitative analysis of them. But you can simply google “Keltner channel” & you’ll get a basic idea of what the math is.
42/51 Moving on, another quant tool that I use on an adhoc basis is a volatility adjusted measure of the current bar on the chart. If that sounded a little too complex, let me break down the math for you.
Let’s say you want to calculate the sigma for T-1 or yesterday’s bar.
Let’s say you want to calculate the sigma for T-1 or yesterday’s bar.
43/51 You simply do the following.
A. calculate the standard deviation of fractional change of the last 20 bars, starting day before yesterday I.e T-2. Let’s call this S.D.
B. Calculate the fractional change for today’s bar. Let’s call this change.
C. Sigma = change / S.D.
A. calculate the standard deviation of fractional change of the last 20 bars, starting day before yesterday I.e T-2. Let’s call this S.D.
B. Calculate the fractional change for today’s bar. Let’s call this change.
C. Sigma = change / S.D.
44/51 This is something picked up from Adam Grime’s work. He calls it the “Sigma”, so we call it by the same name.
This is something that we’ve found incredibly powerful. Its by far the best tool we have found till date for standardizing move measurement.
This is something that we’ve found incredibly powerful. Its by far the best tool we have found till date for standardizing move measurement.
45/51 For example, if I tell you that some stock closed 2% higher from yesterday. Can you tell me how significant is that? You really can’t.
That’s because every instrument has different characteristics & nature of movement.
That’s because every instrument has different characteristics & nature of movement.
46/51 For some markets, a 2% move might be a massive move whereas it might be absolutely normal for some other instrument. That’s exactly where a volatility adjusted measurement comes into picture.
47/51 Now, because while calculating the sigma measurement, you measure the current move with respect to a 20-day historic volatility of that instrument, it gives standardized measurement of the move.
48/51 So now, when any market, any chart whatsoever makes a move of over 2 or 3 sigma, you straight away know that it “might” be something significant!
49/51 This absolutely doesn’t mean you blindly enter into a trade in the next bar, but that’s a good start to standardizing the measurement of a move.
50/51 To wrap it all up, the main message here is to keep all your charts standardized and as clean as possible & let your eyes get used to looking at them consistently in a standardized format.
51/51 Getting good at chart analysis is really about exposing yourself to enough charts, and letting your neural networks do what they do the best – form deep and meaningful connections in seemingly random & infinitely vast data.
Focus more on the chart, less on the art.
Focus more on the chart, less on the art.
• • •
Missing some Tweet in this thread? You can try to
force a refresh


