
The last 3 days is one of the longest deep dive debugs we've had in years. We finally got the culprit for some timeouts this afternoon: the compiler. It eats more CPU in a later version, not by much, but enough. Here's a segment of our build with .NET SDK 3.1.402 vs. .NET 5.0.101 


Note: we've run builds on our web tier for the past decade. Why? Because they're typically at 5-10% CPU and we don't have a lot of hardware - so we used the spare capacity. Now, with Roslyn pegging all cores in that spike, it finally hurt.
Let's walk through the past few days.
Let's walk through the past few days.
Typically, our web tier is very idle, you could say it's boring. Thread pool queues sit at 0, the largest app sits at 1-4% CPU, and concurrent requests are generally sub-10 (because they're in and out fast). It looks like this (last 7 days - note the spikes the past few days):


Our requests are in the low millisecond range, with median response time (server rendering a page) is about 3-8ms these days, with 95th percentile sitting in the 30-50ms range most days. We're pretty fast on renders, but also: we *depend* on being fast, to run on little hardware.


So, we saw timeouts in the error log. We had a Redis timeout but that was a red herring, and we saw SQL connection pool timeouts. Okay cool, we have a slow SQL query - let's track it down.
But we couldn't, because it's intermittent (order of hours). Bah, what a pain.
But we couldn't, because it's intermittent (order of hours). Bah, what a pain.
Those errors looked like this - generally affecting 100-500 requests when a batch occurred:


We couldn't catch the connection pool issue in the act because it was *so brief*, on the order of 300ms, that we never caught it. So, we upped our debugging game: when a connection pool timeout occurs, we'll now log *all pooled connections* (a snapshot) to go look at, like this:

What this showed was the sidebar on Stack Overflow questions (where you see related and linked questions) was generally 110-140 of the 150 open pool. Okay, WE'VE GOT IT! Let's go debug that query.
After digging on this query (thanks @tarynpivots!), we did optimize it a bit more, but couldn't repro the issue either. This was about the end of the day and we left again defeated to think on it some more. It was affecting ~0.0001% of requests, so not an all-nighter level.
@tarynpivots Thanks to @marcgravell's connection logging there, we figured out it wasn't that, but then what? Why was it showing as such a culprit?
As a shower thought this morning, my new theory was that that query was a victim of thread pool starvation. Let me explain the reasoning...
As a shower thought this morning, my new theory was that that query was a victim of thread pool starvation. Let me explain the reasoning...
@tarynpivots @marcgravell That sidebar query is one of the newer things we've touched, I re-worked it months ago to eliminate a lot of caching and Gen 2 we were storing but not using. So, it was async. Importantly: it's the only async query in that path. Also: we open/close connections around each query.
@tarynpivots @marcgravell The reason we open/close around each query in hot paths is the performance tradeoff is worth it to not block. Because if we open/close for a request, anything that stalls in a request, you eat that time in SQL connection pool time reservation, not using it, but starving others.
@tarynpivots @marcgravell So, why do we see that query as an apparent request murderer when it's a victim? Async. Async is really a series of "put me in line", and if the line explodes in size, you'll wait a while. It goes like this:
- .OpenAsync()
- .QueryAsync()
*stall event*
- .CloseAsync()
Uh oh.
- .OpenAsync()
- .QueryAsync()
*stall event*
- .CloseAsync()
Uh oh.
@tarynpivots @marcgravell So what it appears to be (when looking at the connection pool's current reservations) is a query is taking a long time. But it wasn't. We weren't processing the results and closing the connections, because those events were waiting in line...to release their connections.
@tarynpivots @marcgravell Think of it as a deadlock.
You're in a line of 100 people at a tool store.
There are 5 tools for rent.
All 5 are checked out.
You're first in line, but there are no tools available.
It's ironic that the person a few steps behind you is here to return one, huh?
That's the case.
You're in a line of 100 people at a tool store.
There are 5 tools for rent.
All 5 are checked out.
You're first in line, but there are no tools available.
It's ironic that the person a few steps behind you is here to return one, huh?
That's the case.
@tarynpivots @marcgravell So, how do we prove any theory? What if we could see all thread stacks from the process at the moment of pain?
We have our moment: connection pool exhaustion (when we're logging earlier). How do we dump all stacks from inside the process? Luckily @m0sa is onboard with crazy.
We have our moment: connection pool exhaustion (when we're logging earlier). How do we dump all stacks from inside the process? Luckily @m0sa is onboard with crazy.
@tarynpivots @marcgravell @m0sa This is where @m0sa's new class Dumpster comes in. By invoking some bits in Dbghelp.dll, we can .Fire() off a minidump (or any dump we want) from our own .NET process to analyze. Very cool:


@tarynpivots @marcgravell @m0sa With this, we waited very impatiently for the next occurrence, not doing much else (there's irony here later). After a while, we got another event and...a dump! Yay! Let's fire that sucker up.
What we saw was only threads waiting on connections from the pool, lots of .Open().
What we saw was only threads waiting on connections from the pool, lots of .Open().
@tarynpivots @marcgravell @m0sa Well...that's weird. What's using the connections? We've got the 100 people in that store line waiting on connections.
Yeah, all the connections are behind them in queue, waiting to be returned for use. Dammit. But, we don't see that in a minidump (chosen so we stall minimally).
Yeah, all the connections are behind them in queue, waiting to be returned for use. Dammit. But, we don't see that in a minidump (chosen so we stall minimally).
@tarynpivots @marcgravell @m0sa This jives with the theory, but our monitoring doesn't show much of a CPU spike at all. So: what gives? Here's a graph of the web tier CPU over the same 7 day time frame as the other graphs:
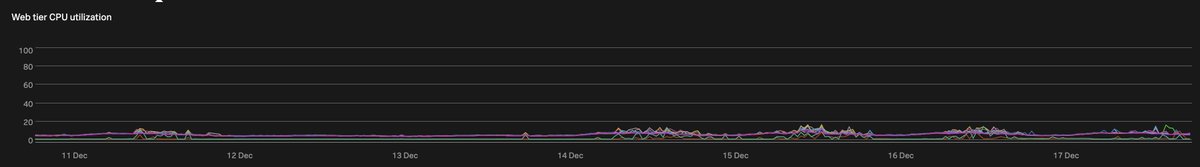
@tarynpivots @marcgravell @m0sa This is where graphs ARE LIARS. I explained this a few years ago for anyone curious:
https://twitter.com/Nick_Craver/status/1038747663636877312- basically, that graph is averages over some interval. Importantly: you don't see spikes small in duration. They get averaged, and flattened out *greatly* here.
@tarynpivots @marcgravell @m0sa So, let's hop on the box and look at much smaller windows of time. Those graphs we started with, here's what was happening. That box was pegged, for almost 2 seconds. This is why knowing what your monitoring is and isn't saying is important. Look at reality:

@tarynpivots @marcgravell @m0sa Ultimately, @deanward81 started poking here at the spikes and we found that builds were our CPU users. This was new with the .NET 5.x SDK rollout to our tier. Importantly: some builds were pinned in global.json and some are not. Those using a 3.1.x SDK Roslyn weren't causing it.
@tarynpivots @marcgravell @m0sa @deanward81 I want to emphasize, the .NET 3.1.x Roslyn is not that different from 5.x Roslyn, just *enough* of a performance difference to matter. Remember: timeouts as a threshold, hitting it or not is binary. The 1-3 second all-core peg on the 5.x release is *just enough* to cause boom.
@tarynpivots @marcgravell @m0sa @deanward81 For now, we've pinned out builds back on the 3.1.x SDK line (latestMinor) and mitigated the issue. Long-term, as was already planned, we're moving to GitHub Actions to build, so: this problem was going away anyway...but now, not soon enough. We'll add a step: more build servers!
@tarynpivots @marcgravell @m0sa @deanward81 In the end, we got the cause, awesome new debug tooling, reported the regression to the Roslyn team (I have some messages to answer right after this thread), stability for the holidays, and a plan.
3 days unexpectedly, but well spent. I hope this info helps someone else!
3 days unexpectedly, but well spent. I hope this info helps someone else!
I just wanted to add a bit more: the misleadings. When you're debugging something, you're chasing the symptoms which you identify with a thing as likely, but it could be some other (or many) things, or those could be symptoms of another thing and you're at least 1 step away.
For example: when we saw these timeouts, most of the time it was one server, but sometimes 2 and rarely 3 would occur at the same time. This overall points to an external actor to the app - it's cross-machine! What could it be? A cache expiring and blocking? Network issues?
You look for patterns if it's cache, for example something expiring every 10 minutes, so there's a chance every 10 of pile-up. But then: why not all servers? What's common about those? Why does the timeout issue hop around? It's a puzzle.
If you look at the end result: builds, the symptoms align, but it's not something you'd jump to. It's because a few repos (like Stack Overflow primary) have a few builds that kick off simultaneously...on multiple agents. That's where multi-machine and simultaneous came from.
For the curious, Dumpster.Fire() was heavily based on dotnet dump - an awesome tool available for .NET Core. Here's a link from @m0sa for the implementation there:
github.com/dotnet/diagnos…
Note calling it internally with:
System.Diagnostics.Process.GetCurrentProcess()
github.com/dotnet/diagnos…
Note calling it internally with:
System.Diagnostics.Process.GetCurrentProcess()
• • •
Missing some Tweet in this thread? You can try to
force a refresh


