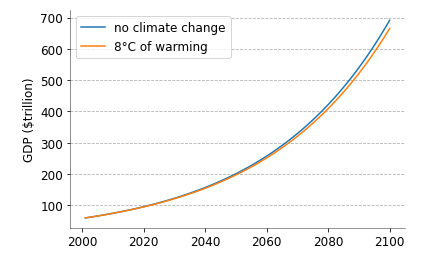
There is no result that disqualifies climate economics more than this one. 8°C warming = loss of ~10% of GDP???? As a reminder, the last ice age was about 6°C cooler than today. Now imagine changes as big as those occurring over the next century or two. This result is absurd.
This plot shows GDP curves (growing at 2.5% and 2.46%) that differ by 4% in 2100. This is analogous to Lomborg's worlds with no global warming and a world that warms by 8°C in 2100! Image
8°C is getting close to temperatures during the Eocene, when there was no permanent ice on the planet.

NH land will warm more than the global average, so 8°C global avg. probably corresponds to something like 12°C (22°F) over NH land (and even more in the Arctic).
If summertime warming over NH land is 15°F (b/c winter will warm more than summer), places where summer temps average 90°F today will average 105°F with 8°C of warming. Heat waves would be far, far worse.
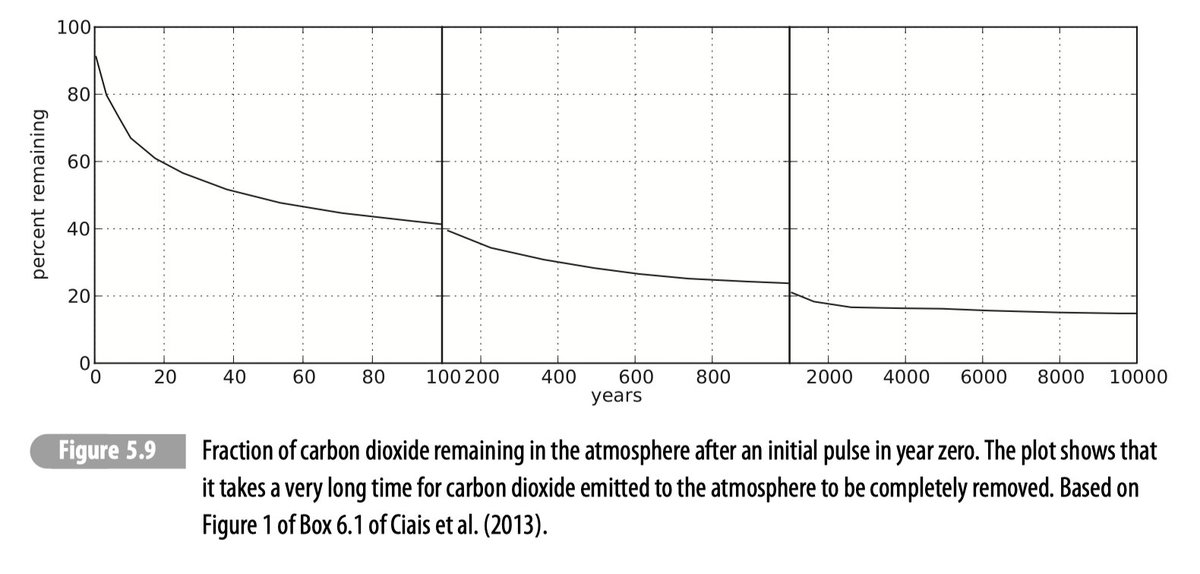
Sea level rise with 8°C of warming will be hundreds of feet. The only good news is that such warming will take centuries/millennia, so Lomborg can discount those impacts to zero.

• • •

Missing some Tweet in this thread? You can try to force a refresh
 

Keep Current with Andrew Dessler

Andrew Dessler Profile picture

Stay in touch and get notified when new unrolls are available from this author!

Read all threads

This Thread may be Removed Anytime!

PDF

Twitter may remove this content at anytime! Save it as PDF for later use!

Try unrolling a thread yourself!

how to unroll video
  1. Follow @ThreadReaderApp to mention us!

  2. From a Twitter thread mention us with a keyword "unroll"
@threadreaderapp unroll

Practice here first or read more on our help page!

More from @AndrewDessler

27 Aug
If you hear a "reasonable middle bro" who "cares deeply about the environment" but tells you that "climate change is not making hurricanes worse," they're gas-lighting you.
Let's examine the peer-reviewed science on this issue. From chapter 6 of the IPCC Ocean and Cryosphere report.
See also this web page from NOAA:
gfdl.noaa.gov/global-warming…
Read 17 tweets
19 Aug
REPOST: I've been looking for a good figure showing Extreme temperatures have gone up. After searching without success, I made this, adapted from @DrJamesEHansen's 2012 PNAS paper. Data are from Berkeley earth.
[previous post had an error in the plot; corrected here] Image
The left plot shows the 1951-1980 June-July-August seasonal average for northern hemisphere land (30°N-60°N). The blue area is the coolest is 33% of temperatures, the white area or the middle 33%, and the red or the highest 33%.
The right plot shows the 2011-2020 temperatures. Over the decade, 88% of the seasonal averages would have been in the top third in the 1951-1980 period. Only 1.2% would have been in the coolest third. And 14% are warmer than ANY temperatures in the 1951-1980 period.
Read 10 tweets
16 Apr
Some thoughts on models in thread form:

Climate models are based on physics. Their code describes the fundamental processes that we know drive atmospheric processes: radiative transfer, thermodynamics, the idea gas law, etc. 1/
Despite what you might hear, these models have been thoroughly tested. In fact, I’ve spent much of my career looking at model output and comparing to observations and I am constantly amazed how well climate models do. 2/
Now this doesn’t mean models do everything well. Some process are not simulated from first-principles — e.g., cloud microphysics, which occurs on too small a spatial scale for models to resolve. 4/
Read 10 tweets
25 Mar
This is very interesting article: "How Trump could make public health a partisan issue"

washingtonpost.com/opinions/2020/…
It should be noted that this is how climate science became politicized. When politicians started saying dumb things about climate science ("global warming stopped!"), it left scientists with a choice:
1) say nothing
2) publicly correct the misrepresentation of the science by politicians

Many in the scientific community chose #2, which I think was the morally responsible choice. But once you do this you've implicitly taken sides in the political debate.
Read 6 tweets
21 Feb
Quick thread on why it takes so long to get rid of carbon dioxide in our atmosphere.

Motivated by @hausfath's thread

There are multiple time scales on which CO2 is removed from the atmosphere. If you add a slug to the atmosphere, the first 50% is removed in 50 years, the next half (taking you down to 25% takes about 500 years, the next half (taking you down to 12.5%) takes 10,000+ years.
The decadal time scale is due to transport to land-biosphere & mixed-layer ocean, the century time scale is due to the slower process of transport to the deep ocean, and the very long time scales are the conversion of ocean carbonate to rocks.
Read 6 tweets
22 Jan
Siri, show me what is literally the last thing in the world I'd want to do?
In case people are wondering who William Happer is ...

Just to be absolutely clear: science is all about debate and arguing over science is a big fraction of what scientists do. The key thing to understand is that we debate in the peer-reviewed literature. Live public debates like this give bad actors lots of latitude to mislead.
Read 5 tweets

Did Thread Reader help you today?

Support us! We are indie developers!


This site is made by just two indie developers on a laptop doing marketing, support and development! Read more about the story.

Become a Premium Member ($3/month or $30/year) and get exclusive features!

Become Premium

Too expensive? Make a small donation by buying us coffee ($5) or help with server cost ($10)

Donate via Paypal Become our Patreon

Thank you for your support!

Follow Us on Twitter!