Which developed country would you say is facing the biggest economic slump of all? The conventional answer is the UK. Eg see this @OECD forecast. But here's a thread about an obscure bit of statistical small print which might mean we've been overstating the scale of the recession 
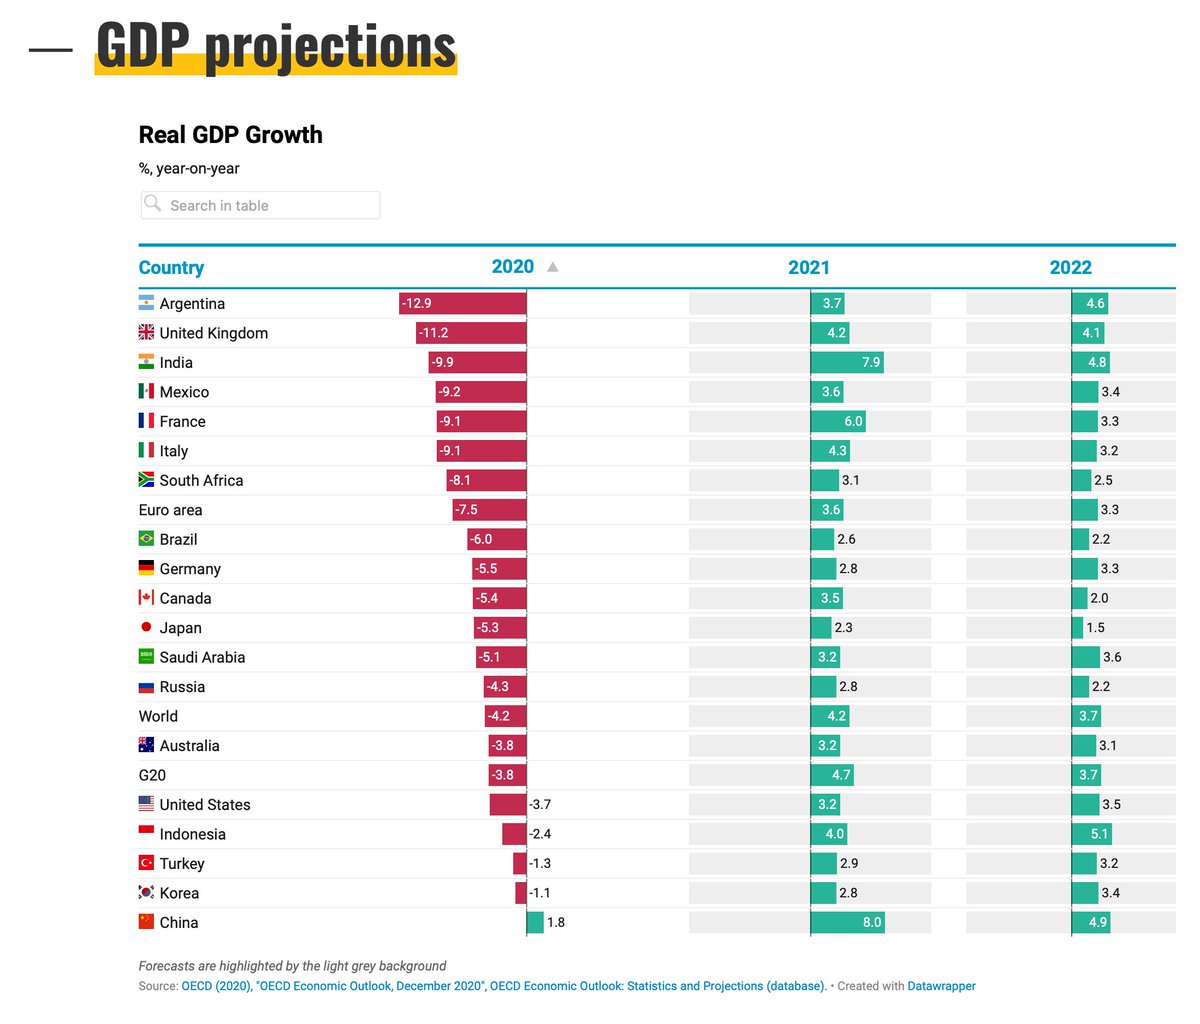
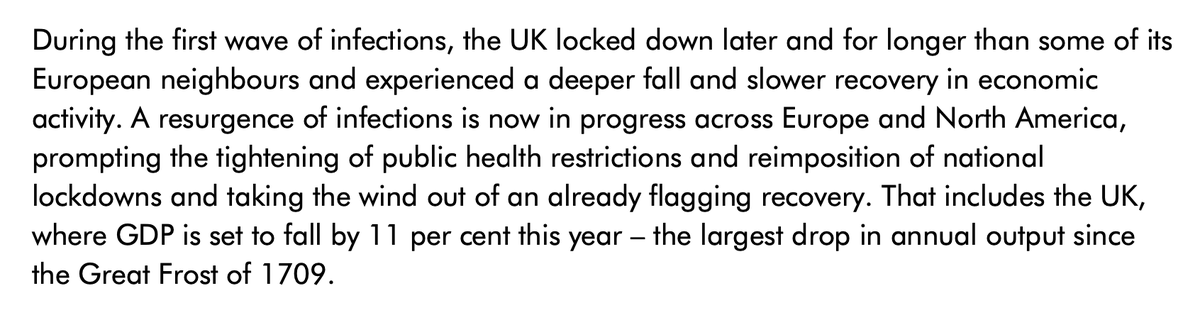
Before we get onto the small print let's deal with what the numbers are telling us. And there's no doubt they're bad. Very bad. Indeed, the @OBR_UK reckons we're facing the biggest slump in GDP since 1709. Down 11% this year alone.
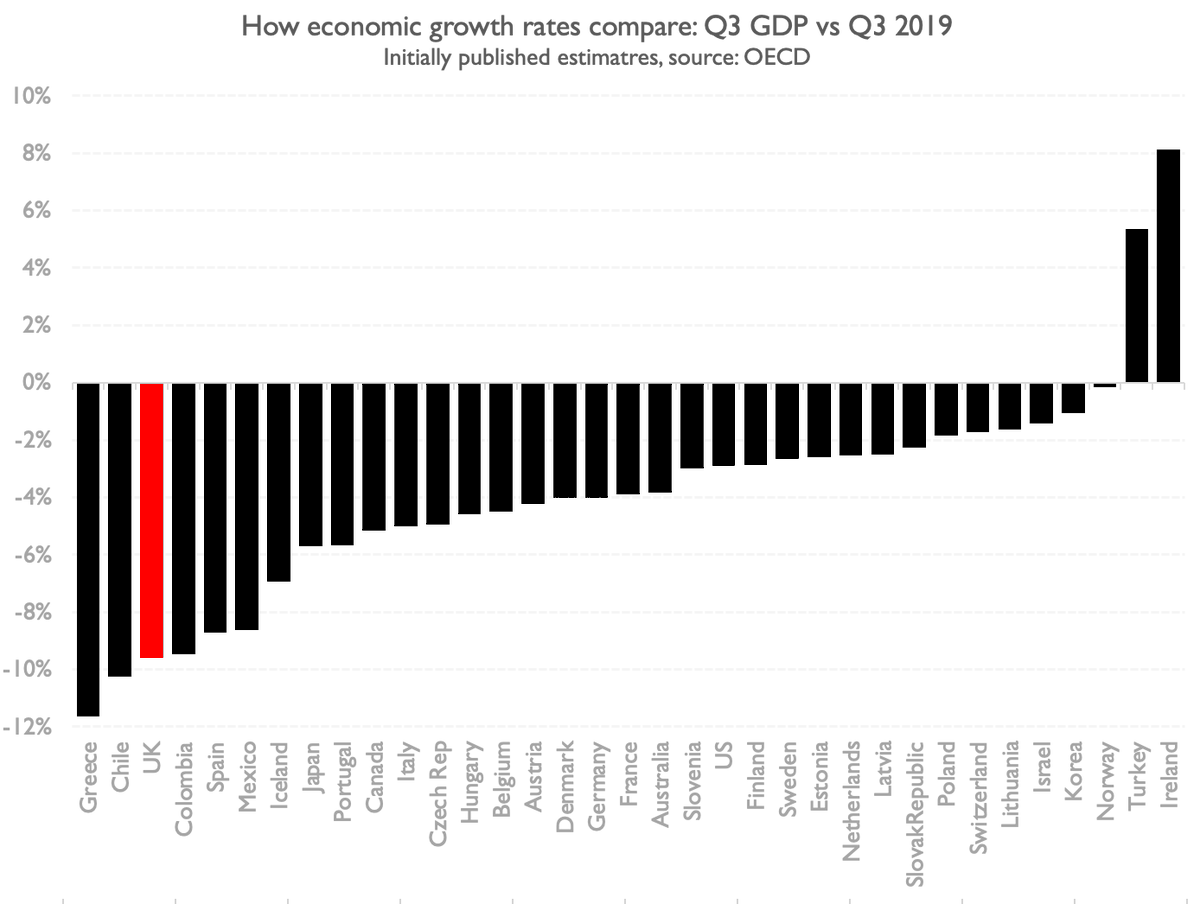
We won't get final 2020 GDP for months (and even that'll be subject to revision). But on the basis of the 1st estimate of Q3 GDP UK contracted at annual rate of 9.7%. So you can see where OBR are coming from ons.gov.uk/economy/grossd…
* yes it was later revised; we'll get to that
* yes it was later revised; we'll get to that
In short: look at the headline GDP figures and it looks like the UK is facing an almost uniquely hideous recession. One of the worst in the world. That 9.7% fall is more than DOUBLE the fall in France, Germany and most other EU nations. Worse even than Spain (-8.7%).
This grim economic news has provided more fuel for those convinced Britain's COVID experience has been far, far worse than everyone's else - both in public health and economic terms. But I have for some time wondered about that chart 👆and whether it really makes sense...
No-one disputes Britain is facing a grim economic period, but is it really plausible that its recession is TWICE as bad as the one in Italy, which also had a very severe COVID outbreak and lockdown? Or more than twice as bad as Belgium or France?
As it happens, the answer is: probably not. To see why we need to delve into how GDP figures are put together. In broad terms, GDP is simply the sum total of everything bought or sold in a country each year. Or total earnings. Or output. They should all add up to the same thing.
For most industries we can observe these kinds of metrics relatively straightforwardly, or we can look at household spending. But one element of GDP has often proved a bit more troublesome: the public sector. How does one measure government activity? This is no trivial matter...
After all, govt accounts for abt 20% of GDP in most European countries, inc UK. Simplest thing to do is to count the total amount we spend on the public sector. The input equals the output. And given one way of getting at GDP is counting total spending, there's some logic to this
This is how the government element of GDP was traditionally calculated, but there are some obvious problems. The more you spend on the public sector, the more your GDP goes up, which is fine in one sense but not in another: GDP should also arguably reflect PERFORMANCE
A pound spent on a life-saving operation should surely count for more in GDP than a pound spent on an administrator twiddling their thumbs? That at least was one takeaway from a review on the measurement of public sector productivity by the late Sir Tony Atkinson back in 2005
Randomly, Sir Tony and his review were the subject of the first newspaper profile I wrote in the Telegraph many, many years ago. I can't bear to re-read it myself but if you can stomach the awkward scribblings of a young hack you can find it here: telegraph.co.uk/finance/289079…
Anyway, the Atkinson Review had some big consequences for the way we calculate the public sector's contribution to GDP. From then on output would in part depend on measurable performance metrics: pupil hours, elective surgery, A&E throughput and so on.
The @ONS assumed everyone was doing likewise - after all the Atkinson Review was in part prompted by an edict from UN and European statistical bodies that national statistics should try to reflect public sector performance, rather than just doing it the old fashioned way.
But, fast forward to today, it seems that might not have been happening. Now, given every developed economy has a differently structured public sector, it's quite plausible that the COVID economic shock would have manifested differently across different countries, but even so...
This chart shows you growth (or contraction) in the government's bit of GDP over the past year. In the majority of EU countries, inc those which imposed similar lockdowns to UK, it rose. In the UK it plummeted. Not just faster than the rest, THREE TIMES FASTER THAN ANYONE ELSE
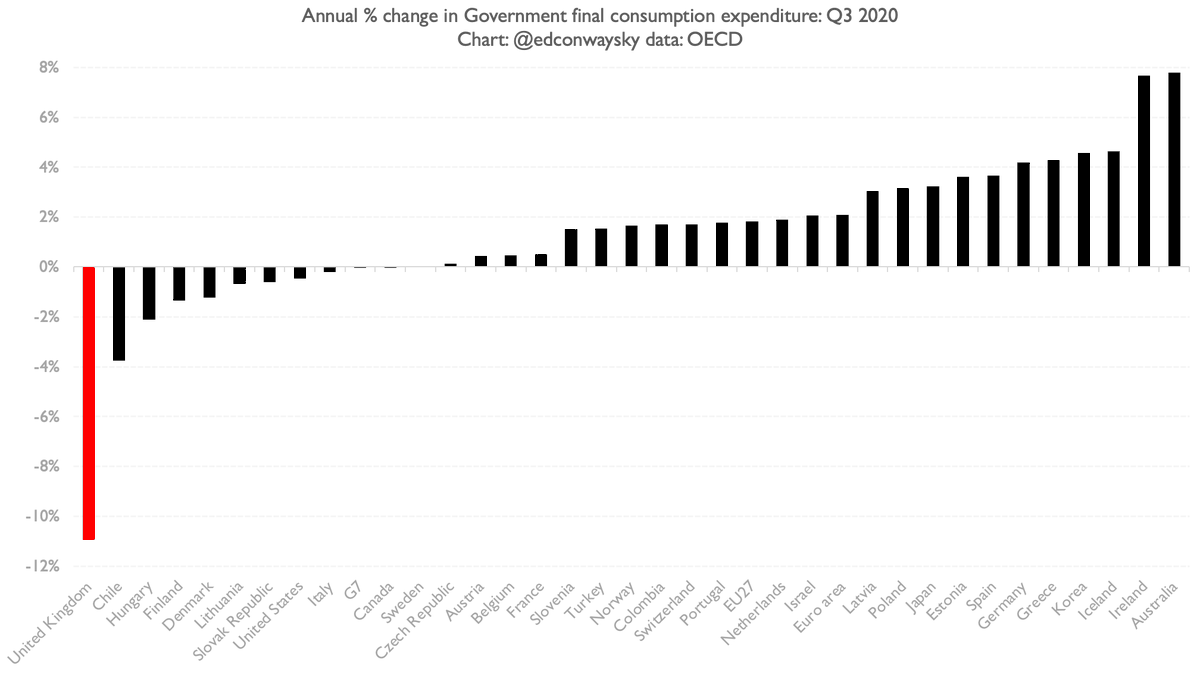
Why? Well, the main reason the UK's pub sector output fell so sharply is that many of the metrics it focuses on collapsed during lockdown: pupil hours (schools closed), elective surgeries (much hospital activity curtailed) etc. The real question is why didn't everyone else's?
After all we know many other countries faced similar lockdowns. So why didn't their pub sector output fall like the UK's did? Why did it rise? The most plausible explanation is that many of them are counting it in the old fashioned way. More public spending equals more GDP.
But it's hard to know for sure because there's scant research on it. I think France counts pub sector GDP the "modern" way but I'm not sure who else. UK officials are quietly trying to persuade @OECD to look into this - as it raises questions about how comparable its stats are.
Within Whitehall there's consternation that UK is suffering because of gold-plating recommendations from international bodies (ignored by others). But the main takeaway is that often statistics are less comparable than they might look. Same thing goes for #COVID19 death stats
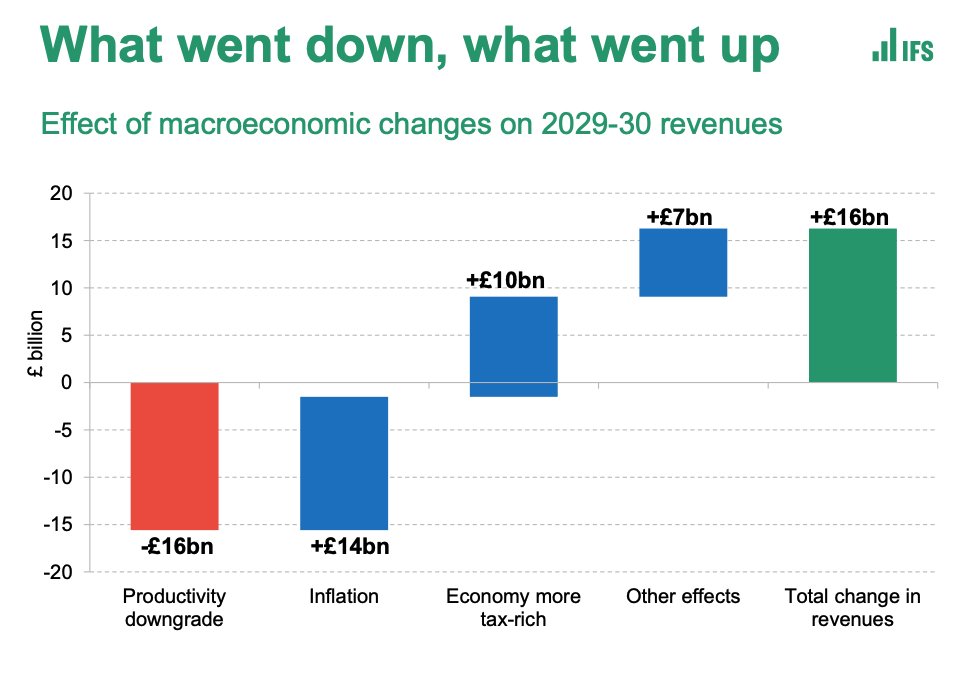
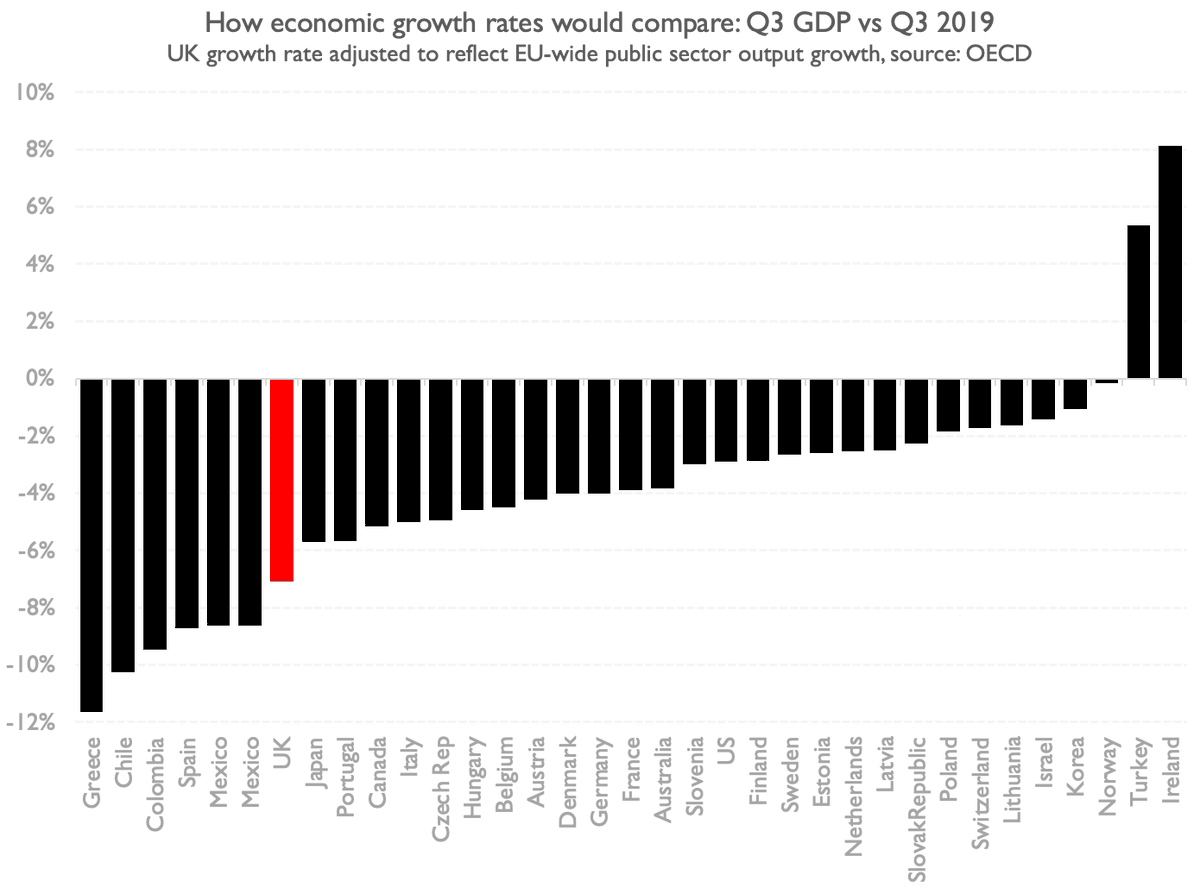
Anyway, let's imagine the UK's public sector output grew in line with the EU average (1.8%). How different would the overall GDP picture look? A bit. UK GDP would have fallen by 7.1% this year. Still awful. But not as bad as Spain, and not all that much worse than Japan or Canada
The @ONS has been scrambling behind the scenes to adjust their public sector output metrics to ensure they better reflect real activity: adding on test & trace and including remote schooling. That partly explains this big GDP revision just before xmas ons.gov.uk/economy/grossd…
Now none of this changes the big picture: the scale of the slump is still enormous (though it may end up being "only" the worst since 1921, not 1709). But it should make us all a bit wary of cross-country comparisons. In time we may know who's fared worse, but prob not for a bit.
This story - how the UK might have been overstating the scale of its recession - is the topic of my @thetimes column this week. Please do give it a read: thetimes.co.uk/article/21229c… And h/t to @simonbriscoe who has written a lot on this topic
I should also mention that @JobbingLeftieH wrote something about this GDP measurement phenomenon a while back: ukandeu.ac.uk/is-economic-ou… and this @ChrisGiles_ column also gets at it, albeit via its impact on the GDP deflator ft.com/content/c5d72d…
More on this topic of UK GDP not really being comparable to other countries. Letter from @StatsRegulation to @simonbriscoe
https://twitter.com/StatsRegulation/status/1354844404494831623
Now the @ONS adds its own analysis on the issue in this thread 👆about the calculation of GDP and cross-country comparisons. Worth a read ons.gov.uk/economy/grossd…
• • •
Missing some Tweet in this thread? You can try to
force a refresh