Rohan Profile picture
Jan 4, 2021 6 tweets 3 min read Read on X
#Lalpathlabs valuation 🧵

History : Image
Sales history :

2011 : 240 Cr
2020 : 1300 Cr

Trend : 20.64% CAGR growth in sales. ImageImageImage
Profit history :

2011 : 30 Cr
2020 : 230 Cr

Trend : 25.39% CAGR growth in profits. ImageImageImage
The company spends almost equal amount on its personnel as it spends on raw materials. Image
Current 12M trend shows a rise in volumes as more and more people opt for blood tests. Profit margin has also risen by 2%. This will add to the long term compounding.

Verdict : Strong BUY. Image
Future projection :

2030 EPS : 170 rs/share
2030 CMP : 8117

Lalpath Labs is a comparatively cleaner proxy play on the healthcare theme, rather than buying debt laden companies like Fortis or Apollo Hospital. Image

• • •

Missing some Tweet in this thread? You can try to force a refresh
 

Keep Current with Rohan

Rohan Profile picture

Stay in touch and get notified when new unrolls are available from this author!

Read all threads

This Thread may be Removed Anytime!

PDF

Twitter may remove this content at anytime! Save it as PDF for later use!

Try unrolling a thread yourself!

how to unroll video
  1. Follow @ThreadReaderApp to mention us!

  2. From a Twitter thread mention us with a keyword "unroll"
@threadreaderapp unroll

Practice here first or read more on our help page!

More from @techlunatic

Sep 16, 2021
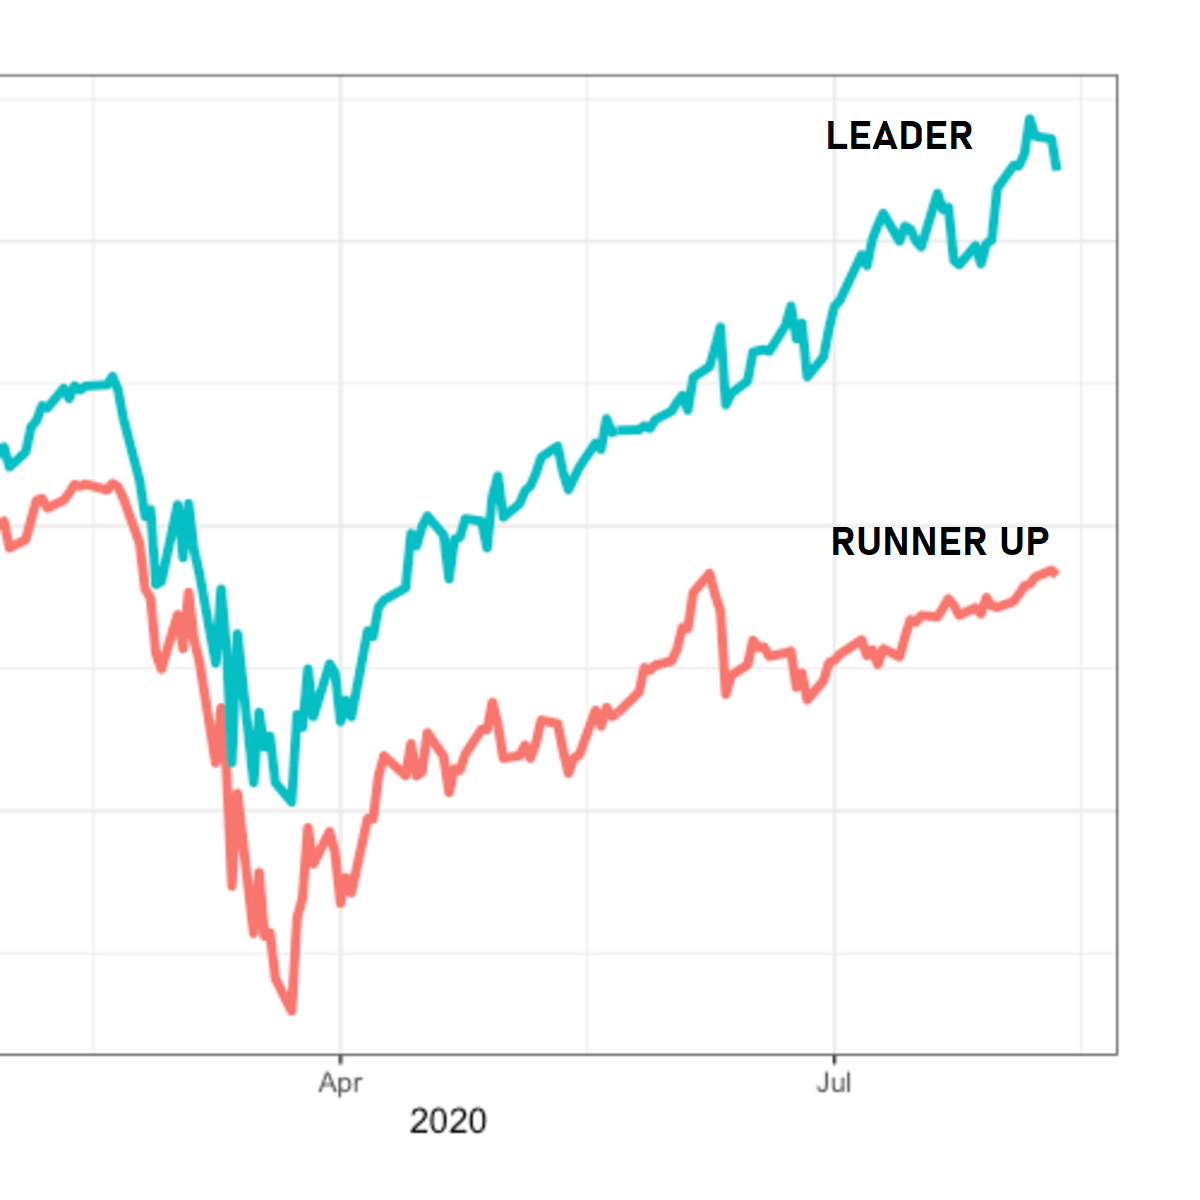
The leaders rally first & become overvalued FAST. There's great premium for showing urgency to pump a lumpsum amount in such stocks early on in the rally.

The laggards start their journey after all the good stocks have already gone up. << One can do SIP in such slow movers. Image
Should we only buy the leaders?

No.

Figure out where we are in the Bull cycle.

Have the leaders..

1. a) taken off in a big way
1. b) or starting to take off

Have the second rung stocks..

2. a) caught up with the leaders
2. b) yet to catch up

Your alpha comes from there
The second rung stocks too have the potential to reach the same destination, albeit, with a lag. Use this lag for timing your investments. If the leader is in a strong uptrend, start SIP-ing into the other one. Catch the leader at any future drawdown.

Read 5 tweets
Sep 9, 2021
A short thread🧵

The US armed forces faced a dilemma during WW2, because returning bomber planes were riddled with bullet holes and they needed better ways to protect them.

The army knew they needed armor to protect their planes but the question was, “Where should they put it?”
When they plotted out the damage these planes were incurring, it was spread out, but largely concentrated around the tail, body and wings. So the most natural impulse was to armor the parts with the most bullet holes.

But..
Abraham Wald, a statistician, made an observation—the military would make a terrible mistake by upgrading the armor along these sections.

Why?

Because the military was only looking at the damage on returned planes. They hadn’t factored in damage on planes that didn’t return.
Read 5 tweets
Sep 8, 2021
Maruti, fundamentals history :

20Y EPS growth CAGR : 12%
10Y growth CAGR: 7%
Current EPS : 140rs /share
Yield at CMP : 2.5%

What is this *Yield? 👍

Explanation in the comments section below 👇 Image
Read 4 tweets
Jul 30, 2021
When a stock falls, it opens up deeper arbitrage opportunities during a 'falling knives' scenario. This discount attracts a rapid influx of fresh cash until the arbitrage opportunity gap is filled (i.e the market stabilizes) to the point of 0 alpha.
Earnings yields is mostly stable and smooth curve. It's the stock price that fluctuates due to sentiments, liquidity, news cycle, perception etc.

Let's say the long term earnings yield was growing at 9%. If you bought at

(A), your returns = 5%.
(B), your returns = 15%
If you track yield, you'll get better entry points and get better bang for buck. If you track only price, there's a risk of getting trapped at (A) where all technical indicators are bullish.
Read 7 tweets
Jul 29, 2021
Stock prices respond disproportionately to free float availability (or lack thereof) than to theoretical Excel valuations. The growth rate x float decides the PE multiple, that's why every co. can't be 15PE. A co. with just 10% float will deviate that much from its DCF valuation.
If there's 2 similar co.'s, one listed (with 15% float available to investors) vs another co. unlisted. The market will arrive (rightly so) at wildly divergent valuations for both. The second co.'s valuation is based on 100% ownership, while the 1st one on a limited supply basis.
If both were listed with 100% float available to free-market forces, or if both were unlisted, then one can do a side by side DCF, otherwise sharing social media infographics comparing stats of Nestle vs Amul, vs ITC without considering locked up float shows lack of wit.
Read 6 tweets
Jul 29, 2021
The central narrative of my investment narrative has never been and will never be :

a) Catching stocks at the bottom
b) Catching potential multibaggers
c) Being obsessed with the chosen few 'potential multibaggers'
d) Buying 'safe' stocks and avoiding errors at any cost.

👇
b) Never treated this as a 'potential multibagger' when I bought it, just a better-than-average candidate among others.
Read 6 tweets

Did Thread Reader help you today?

Support us! We are indie developers!


This site is made by just two indie developers on a laptop doing marketing, support and development! Read more about the story.

Become a Premium Member ($3/month or $30/year) and get exclusive features!

Become Premium

Don't want to be a Premium member but still want to support us?

Make a small donation by buying us coffee ($5) or help with server cost ($10)

Donate via Paypal

Or Donate anonymously using crypto!

Ethereum

0xfe58350B80634f60Fa6Dc149a72b4DFbc17D341E copy

Bitcoin

3ATGMxNzCUFzxpMCHL5sWSt4DVtS8UqXpi copy

Thank you for your support!

Follow Us!

:(