A Thread 🧵
Detailed study on What is divergence and it’s types.
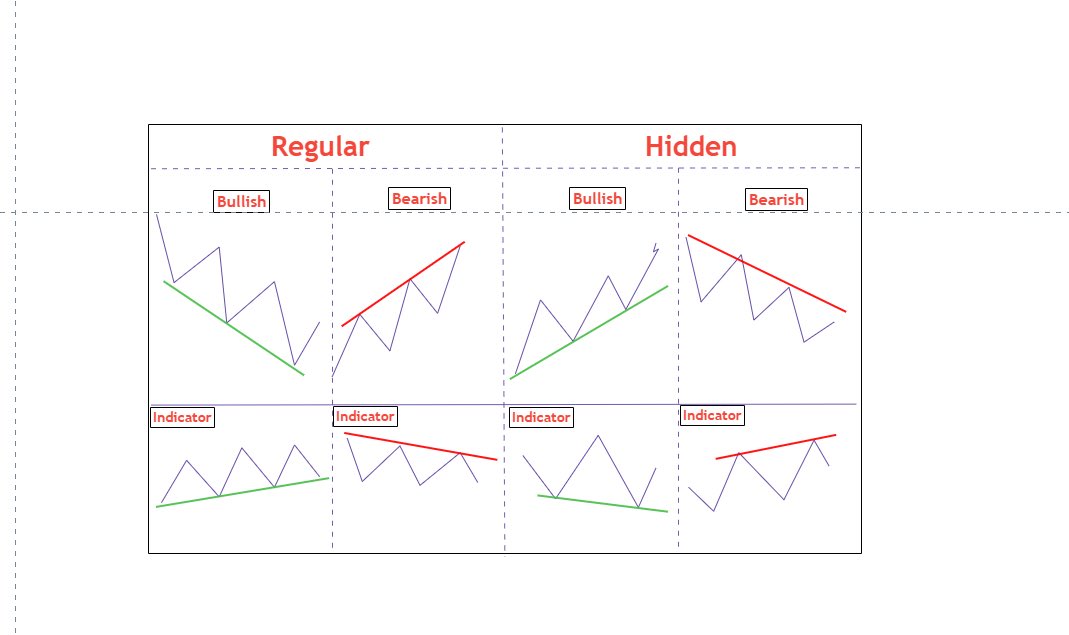
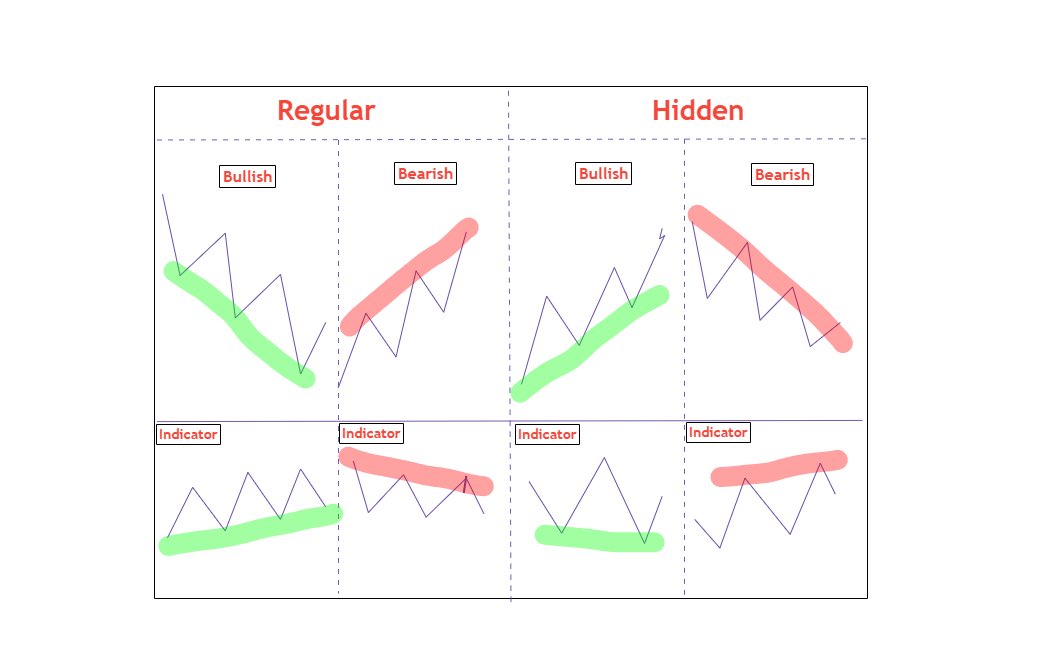
✅ Regular Bullish & Bearish Divergence
✅ Hidden Bullish & Bearish Divergence
Retweet and Like to help Beginners and Others !
Detailed study on What is divergence and it’s types.
✅ Regular Bullish & Bearish Divergence
✅ Hidden Bullish & Bearish Divergence
Retweet and Like to help Beginners and Others !
1- What is Divergence ?
A scenario where price is moving opposite to technical indicator like RSI, MACD.
Divergence tells us whether the trend is weakening or not.
It is the hidden hand of weakness and strength and signal whether to hold a trade or book profits.
A scenario where price is moving opposite to technical indicator like RSI, MACD.
Divergence tells us whether the trend is weakening or not.
It is the hidden hand of weakness and strength and signal whether to hold a trade or book profits.
Regular Divergence
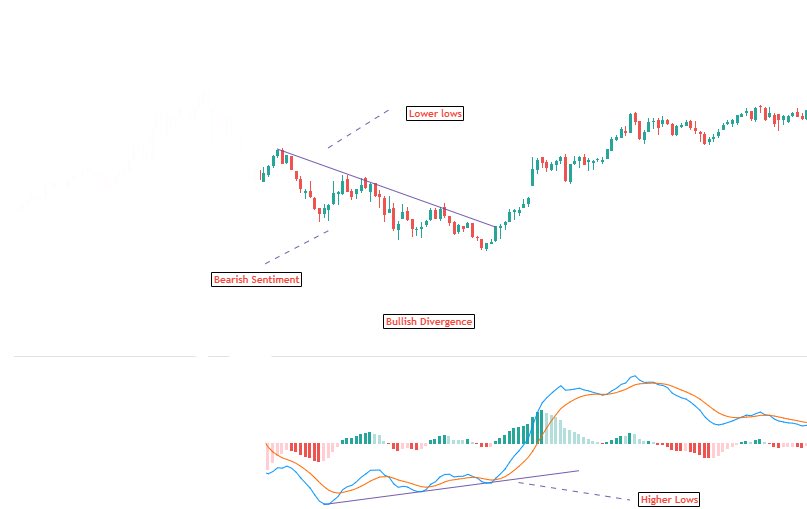
• Regular Bullish Divergence :- Price moves lower low but oscillator has higher lows
✅ Indicates Buy signal
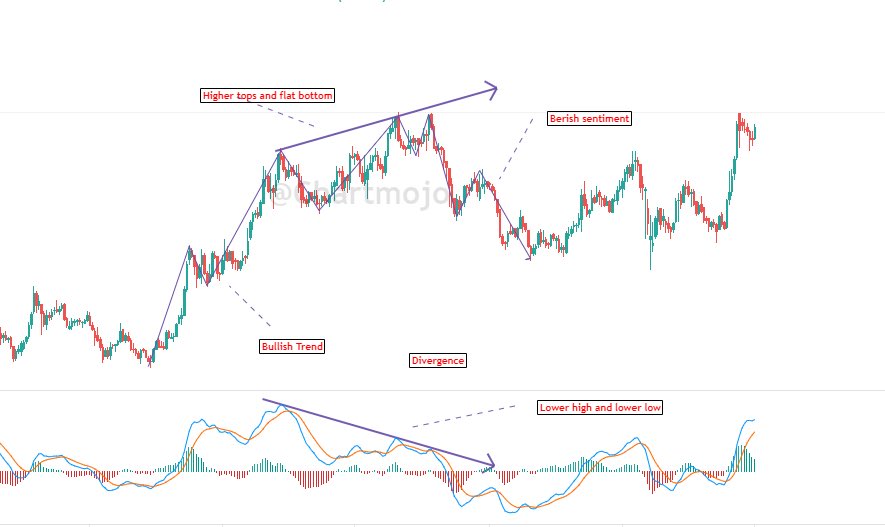
• Regular Bearish Divergence :-
Price Higher high but oscillator higher lows
✅ Indicates sell signal

• Regular Bullish Divergence :- Price moves lower low but oscillator has higher lows
✅ Indicates Buy signal
• Regular Bearish Divergence :-
Price Higher high but oscillator higher lows
✅ Indicates sell signal
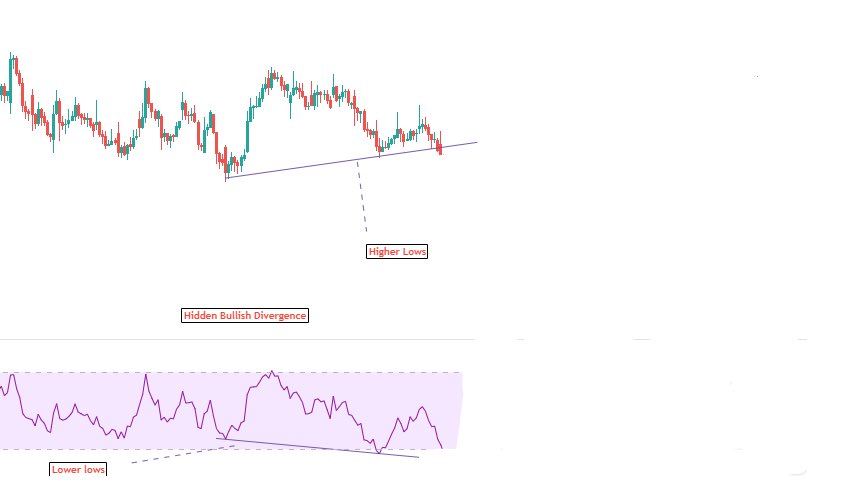
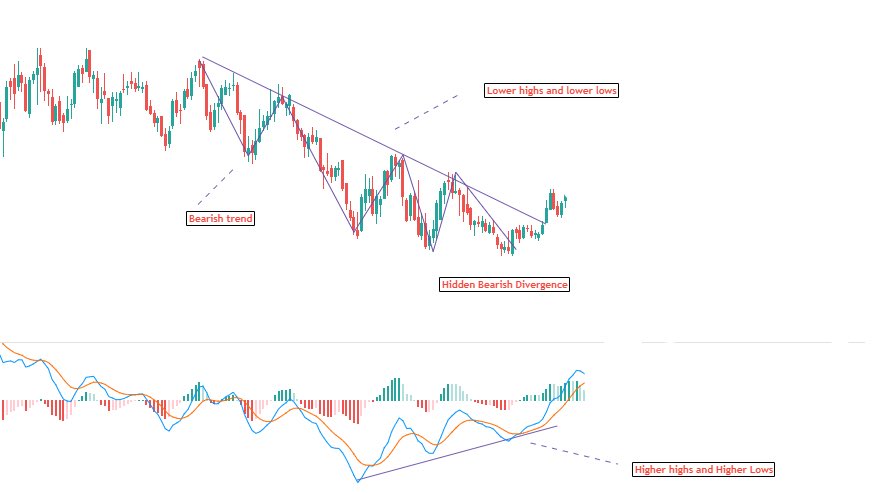
Hidden Divergence
• Hidden Bullish Divergence
price Higher low but oscillator lower low
✅ Indicates buy signal
• Hidden Bearish Divergence
Price Lower high but Oscillator higher high
✅ Indicates sell signal

• Hidden Bullish Divergence
price Higher low but oscillator lower low
✅ Indicates buy signal
• Hidden Bearish Divergence
Price Lower high but Oscillator higher high
✅ Indicates sell signal
• • •
Missing some Tweet in this thread? You can try to
force a refresh
