New Household Pulse covering Dec 9 -21 just released, underscores how desperately relief is needed.

Estimated #foodinsecurity at a pandemic high: 24% overall; 31% among those w/kids. Image
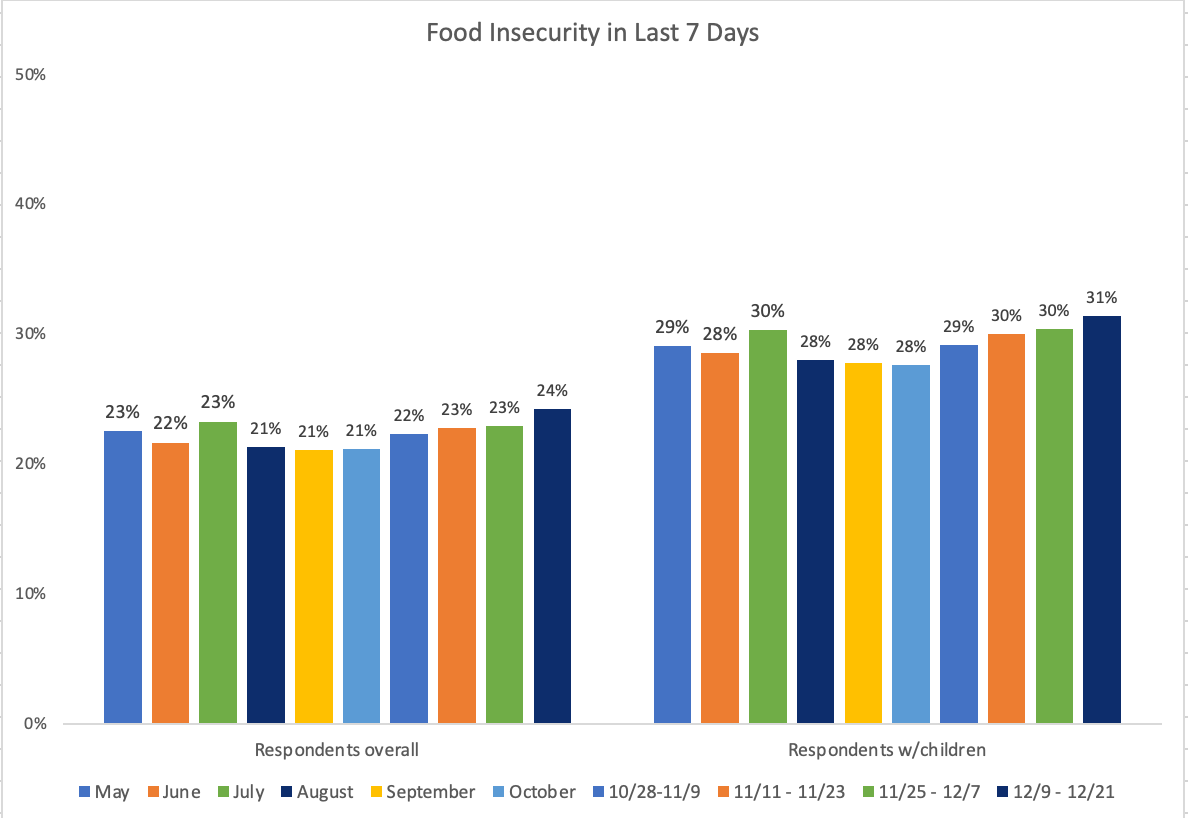
Share reporting sometimes/often not enough to eat last week continued its climb.

18.3% of those w/kids said they didn't have enough to eat.

Really looking forward to seeing these numbers come back down as relief gets into hands of families. Image
The broadest measure is up, too, but not back to its COVID high from July.

Broad measure includes sometimes/often not enough to eat, PLUS "enough, but not the types of foods we wanted." Image
Here's food insecurity for those w/kids, by race/ethnicity. Image
And sometimes/often not enough to eat, for those w/kids, by race/ethnicity.

Let's hope these are the highest rates we will ever see, and that they start coming back down. (That's surely what I expect to see.) Image
Just heard that Pulse will continue until (at least) March -- GREAT news.

I continue to be grateful for the hard work of the statistical agencies for responding to this crisis with more real-time data.

• • •

Missing some Tweet in this thread? You can try to force a refresh
 

Keep Current with Dr. Diane Schanzenbach

Dr. Diane Schanzenbach Profile picture

Stay in touch and get notified when new unrolls are available from this author!

Read all threads

This Thread may be Removed Anytime!

PDF

Twitter may remove this content at anytime! Save it as PDF for later use!

Try unrolling a thread yourself!

how to unroll video
  1. Follow @ThreadReaderApp to mention us!

  2. From a Twitter thread mention us with a keyword "unroll"
@threadreaderapp unroll

Practice here first or read more on our help page!

More from @dwschanz

10 Sep 20
Here's what we've learned so far about the spike in nonresponse in the Census Household Pulse Survey.

Of course, I'm focused on the Q on food sufficiency, but it would be straightforward to extend this to other sections.
New questionnaire is much longer. Like 20 min vs. old 12 min. People drop off as the survey goes on. Here's what nonresponse %'s are, by section, in week 12 vs. week 13. Image
Questions on food used to come 4th, after demographics, employment + spending. 4% nonresponse rate then.

Now food Q's come 6th, behind new sections on benefits and trips. 13% nonresponse rate now.
Read 9 tweets
8 Jul 20
Week 9 of the @uscensusbureau’s Household Pulse data released today! Continued thanks for their tireless work.

#FoodInsecurity top line #’s are back up this week. Estimates still below their peaks, but this week wiped out all the statistical progress made over past weeks.
Remember: Household Pulse asks a/b food SUFFICIENCY, incl. do we have enough food but not types we want, or sometimes/often not enough food. Asks a/b last 7 days.

44% report they are food insufficient; 52% among those w/kids.
I transform data from insufficiency to #FoodInsecurity using the CPS. Usually, a smaller share of those not having “food types wanted” turn out to be food insecure, and (of course) a higher share that “often” or “sometimes” don’t have enough food are.
Read 8 tweets

Did Thread Reader help you today?

Support us! We are indie developers!


This site is made by just two indie developers on a laptop doing marketing, support and development! Read more about the story.

Become a Premium Member ($3/month or $30/year) and get exclusive features!

Become Premium

Too expensive? Make a small donation by buying us coffee ($5) or help with server cost ($10)

Donate via Paypal Become our Patreon

Thank you for your support!

Follow Us on Twitter!