
THREAD: Moving Averages
Thank you guys for the continued support on these threads.
This one will address SMA lines and how we can use them in our trading, not only as indicators but also to help us predict stock potentials.
Feel free to ask further questions in the comments!
Thank you guys for the continued support on these threads.
This one will address SMA lines and how we can use them in our trading, not only as indicators but also to help us predict stock potentials.
Feel free to ask further questions in the comments!

Definition: A simple moving average (SMA) calculates the average of a selected range of prices, usually closing prices, by the number of periods in that range.
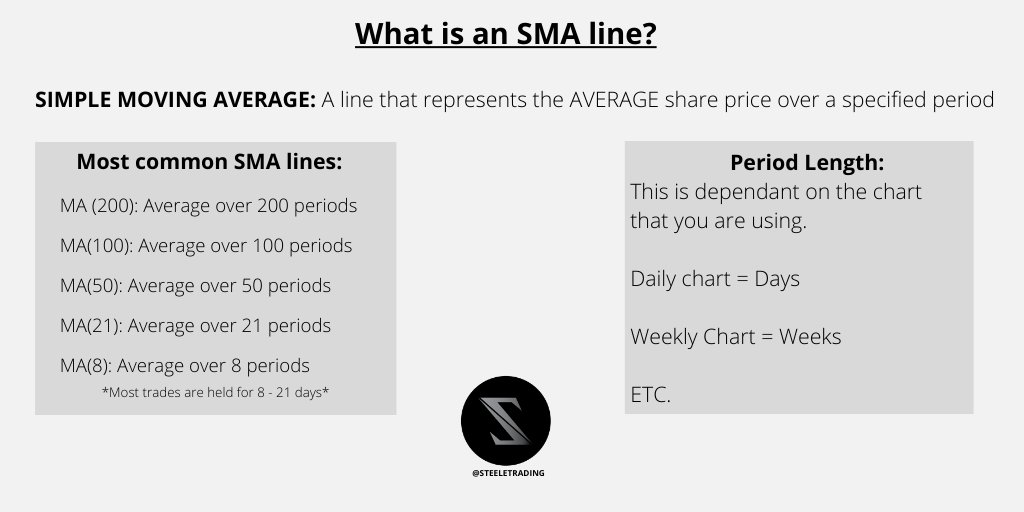
SMA lines are great indicators to use alongside other indicators. They can be great for predicting a coming reversal or a continuation of a trend!

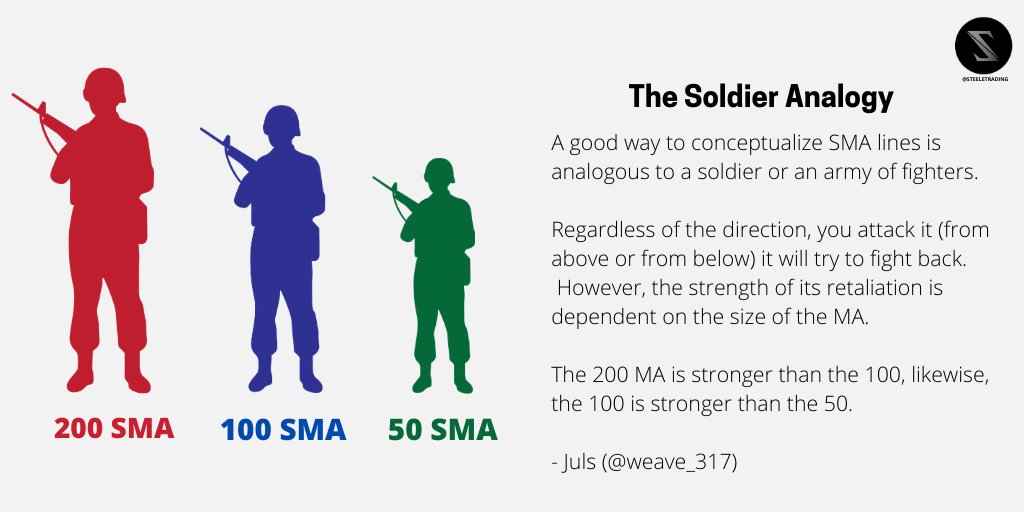
By thinking of SMA lines as a soldier it is a lot easier to understand the difficulties stocks can often have crossing these key levels. It is also great for visualizing that once the SMA is broken, further continuation of trends becomes
easier.
Thank you for this @Weave_317
easier.
Thank you for this @Weave_317
The number one takeaway to have when it comes to SMA lines is that they are KEY LEVELS of RESISTANCES and SUPPORTS depending on what side the price currently lies.

The Golden Cross:
a technical chart pattern indicating the potential for a major rally, it appears on a chart when a stock's short-term moving average crosses above its long-term moving average.
a technical chart pattern indicating the potential for a major rally, it appears on a chart when a stock's short-term moving average crosses above its long-term moving average.

The RSP Golden Cross:
A short-term adaptation of the Golden Cross that I learnt from @RadioSilentplay and the rest of the #RSP team.
A short-term adaptation of the Golden Cross that I learnt from @RadioSilentplay and the rest of the #RSP team.

Price prediction can be a hard part of creating a plan for a trade. While previous runs and gap fills can be great indicators for future prices, so can SMA lines due to the 'Path to least resistance'.

SMA lines are great but they can cause you to make rash decisions if you use them exclusively. For this reason, it is always smart to use SMA indicators alongside other indicators.
(A good general rule of thumb is to look for 3 separate indicators that all agree with each other)
(A good general rule of thumb is to look for 3 separate indicators that all agree with each other)

The 8 and 21 MA are critical when it comes to predicting immediate trends. They can often be used for first indications of emerging trends (like with the RSP Golden Cross).

Again, thank you all for the support and I would really appreciate it if you guys could like and retweet this thread!
Also, comment below on what future topics for threads you would like to see me do.
Also, comment below on what future topics for threads you would like to see me do.

• • •
Missing some Tweet in this thread? You can try to
force a refresh


