Some people have been worried about high numbers of pupils attending schools since 4 Jan.

Children are (generally) not at risk of serious illness but concern was new variant wd cause fast spread in children, which cd then spill over to others.

We now some early data to look at.
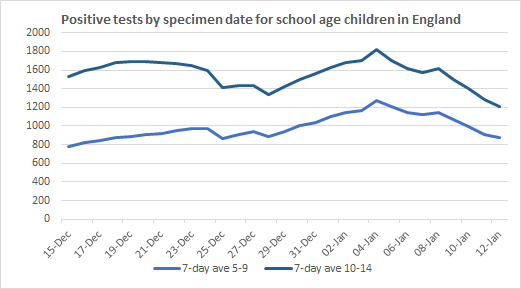
First positive tests (7-day ave) for 5-9 & 10-14s. Allowing a 7-day lag to test, infections seem to increase during 1st part of holidays (but beware Christmas testing effects), then decrease from end of Dec. Early days, but so far looks like the decrease has continued since 4 Jan
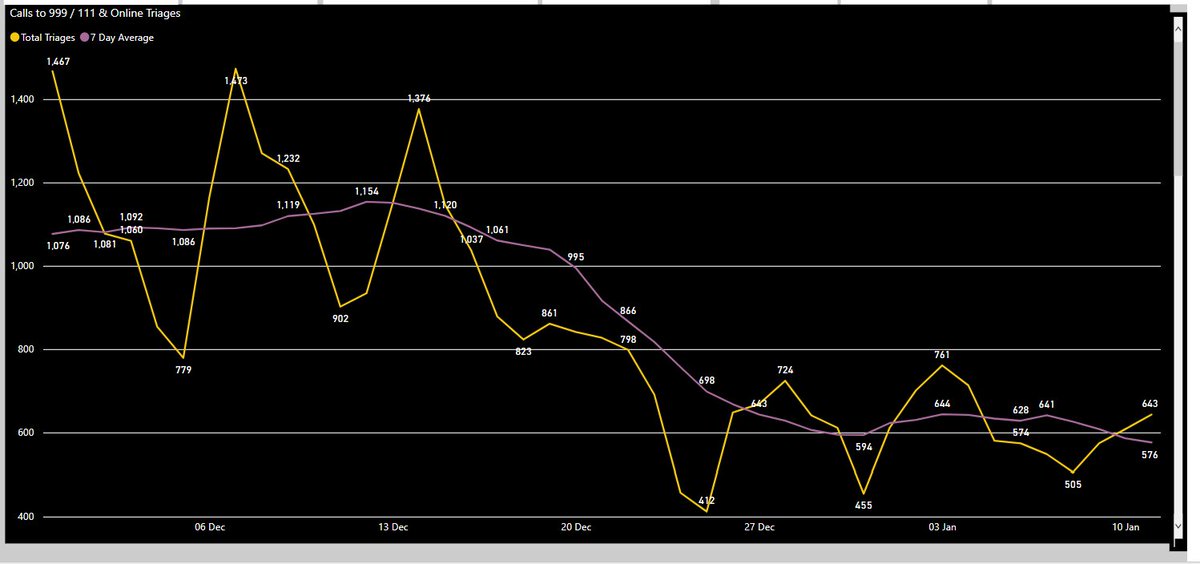
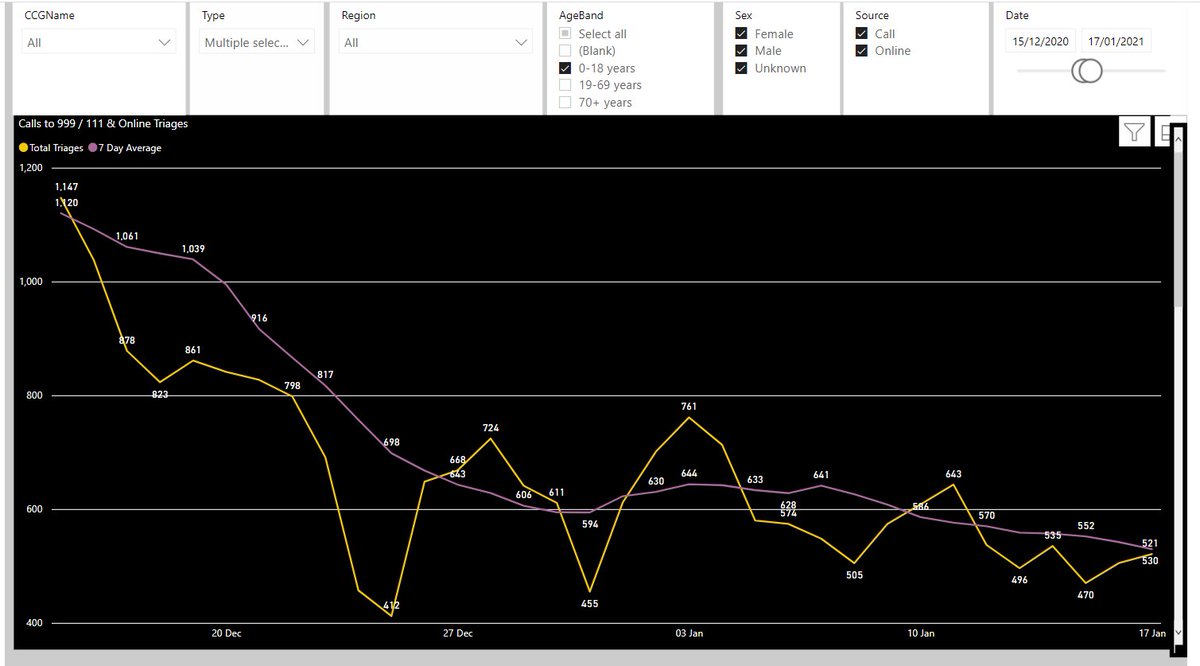
Next NHS Covid-19 triage for U19s. Lag probably shorter than for tests.

7-day ave trend suggests infections leading to triage decrease before schools shut for Christmas, level off during holidays & then decrease again from about 4 Jan.

(Thanks to @dontbetyet for the chart)
So early indications that concerns about schools may have been misplaced: no obvious sign holidays reduced infections in children, nor of any increase following 4 Jan limited school openings.

Will this give Ministers confidence to allow all pupils back to school after half-term?

• • •

Missing some Tweet in this thread? You can try to force a refresh
 

Keep Current with David Paton

David Paton Profile picture

Stay in touch and get notified when new unrolls are available from this author!

Read all threads

This Thread may be Removed Anytime!

PDF

Twitter may remove this content at anytime! Save it as PDF for later use!

Try unrolling a thread yourself!

how to unroll video
  1. Follow @ThreadReaderApp to mention us!

  2. From a Twitter thread mention us with a keyword "unroll"
@threadreaderapp unroll

Practice here first or read more on our help page!

More from @cricketwyvern

16 Jan
This is an interesting read by @cjsnowdon but not sure his examples necessarily support his case.

Take Ireland: Level 5 lockdown restrictions (pubs, cafes hairdressers shut) started on 24 Dec. The vertical rise in cases started 8 days after that on 2 Jan & continued to 8 Jan. Image
More restrictions were added up until 31st Dec & cases started dropping from the 9th. But you could just as easily claim the 24th Dec restrictions caused the vertical rise on the 2nd as to claim the extra restrictions caused the drop on the 9th.
I don't think Ireland reports by specimen date & also there were reporting lags. So probably pretty hard to be certain about any cause & effect, but it's not exactly a poster case for lockdown restrictions.
Read 7 tweets
13 Jan
Good question! Of course bad news sells for the media but it seems to be Govt strategy not to focus on any good news at the moment.

Same in April when they were highlighting high reported deaths each day & ignoring that deaths-by-date were showing we had passed the peak.
I get that the Govt is worried if people hear things are improving, they may change their behaviour & spread the virus more.

Personally, I would argue it is far better to treat the public with respect & to provide balanced, accurate information whether good or bad news.
At the moment the balanced message would be that infections are decreasing in most parts of the country (especially London) whilst at the same time many of our hospitals remain under immense pressure.
Read 7 tweets
12 Jan
Data over the past week has utterly demolished the case made last week for the latest national lockdown, i.e. that infections (and subsequently hospitalisations) would not decrease without another full lockdown.
Current indicators show infections were decreasing nationally before lockdown 3, the most dramatic falls being in London, SE & E, but most regions decreasing.

(& let’s be clear: the more promising trends were already becoming evident even when lockdown was announced last week).
You can credibly make a case for Level 4 restrictions on the grounds they were having some effect. FWIW, I don't think there is anything in the data to suggest that, but let's put that to one side for now.
Read 6 tweets
12 Jan
Zoe symptom estimate for England down again today (data up to 8th Jan) & now 13% below recent peak.

All regions except NW below peak: London 28% down, East 20%, SE 16%, NE&Y 9%, Mids 8%, SW 4%.

Given infection-symptom lag, decreases will relate to pre-lockdown infections.
The Zoe estimates have been a pretty reliable early indicator but the decrease is also evident in other indicators: NHS triage, positivity % & positive tests have also all decreased nationally & especially in London, East & South East.
NHS triage data goes to 11 Jan so should pick up at least the start of any effect of schools re-opening to key workers from 4th Jan (+ to nearly all primary pupils for 1 day the 4th). So it is good to see U19 7-day ave falling.

n.b. big thanks to @dontbetyet for the chart.
Read 4 tweets
12 Jan
A couple of puzzles in the ONS deaths series which is by death certificate compared to PHE which is "within 28 days of a positive test".

1. Why has the ONS trend diverged so much from the PHE since Nov (though both are increasing)?

Here are both trends as % of their April peak.
So by 29 Dec, PHE reached about 60% of the April peak, whilst the ONS measure only reached about 40%. Of course both will go up further given the surge in cases, but still a puzzle (to me at least) why they have they diverged so much.
Note the latest ONS figures go up to 1st Jan but I have dropped the last few days as these will be updated. There may be more than usual catch up to come in the registration data over Christmas, but the divergence starts in early November.
Read 5 tweets
11 Jan
Zoe symptom estimate data for England (at 7 Jan) now down 11% from the peak. London is now 25% down. All regions decreasing except SW (3% below peak but still up & down) & NW (increase seems to be levelling off).

Note this still relates to infections in pre-lockdown period.
This is consistent with other indicators: test positivity, positive tests & NHS triage data. e.g. 7-day triage average down 5% from recent peak in England, 11% in London.
Of course hospitalisation data are still a big worry but remember those will lag infections so it will take a bit of time for the decrease in infections to feed through.
Read 4 tweets

Did Thread Reader help you today?

Support us! We are indie developers!


This site is made by just two indie developers on a laptop doing marketing, support and development! Read more about the story.

Become a Premium Member ($3/month or $30/year) and get exclusive features!

Become Premium

Too expensive? Make a small donation by buying us coffee ($5) or help with server cost ($10)

Donate via Paypal Become our Patreon

Thank you for your support!

Follow Us on Twitter!