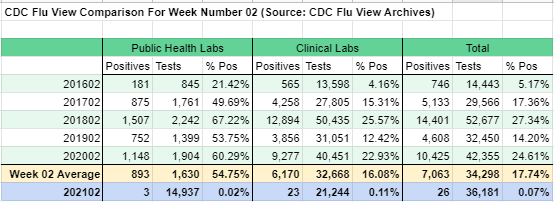
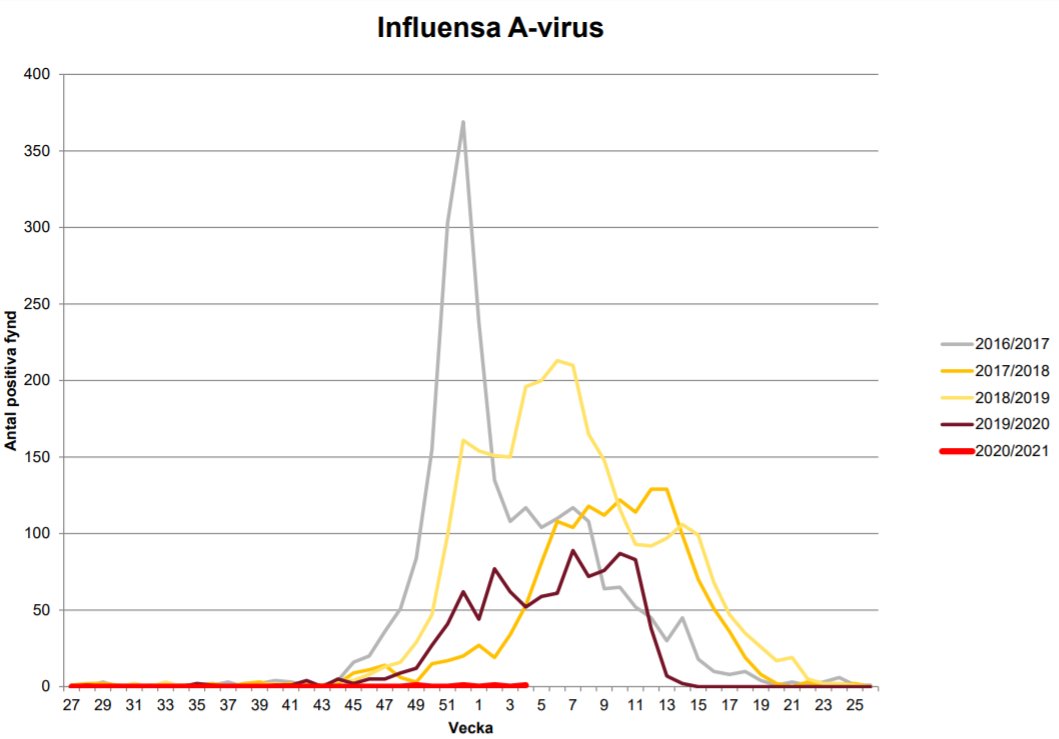
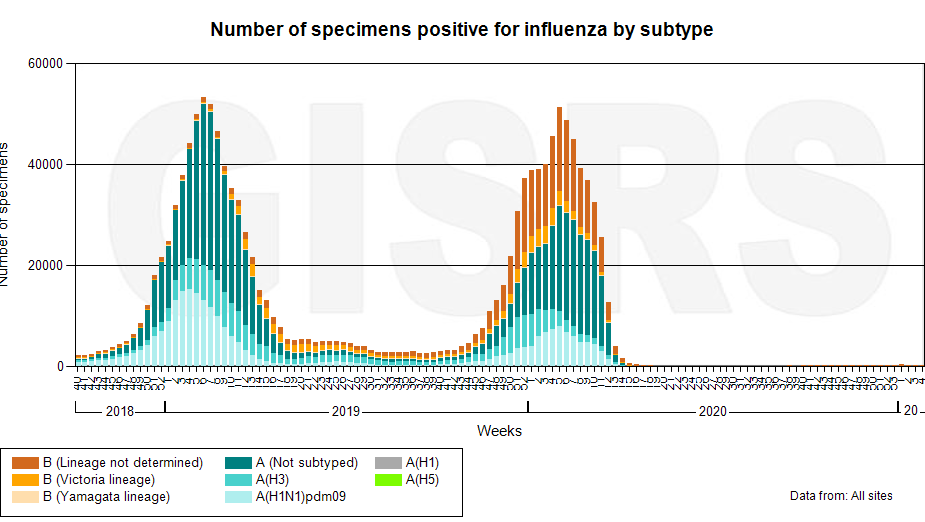
United States Influenza testing, MMWR week 4.
CDC flu view. cdc.gov/flu/weekly/ind…
Five-year average: 9,051 cases; 21.39% positive
Last year: 13,844; 28.99%
This year: 28; 0.1%
docs.google.com/spreadsheets/d…
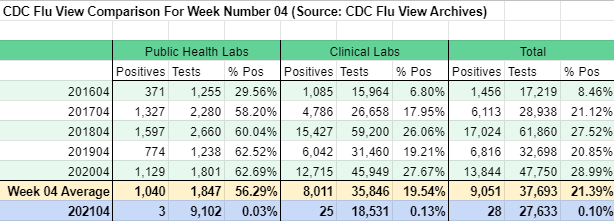
CDC flu view. cdc.gov/flu/weekly/ind…
Five-year average: 9,051 cases; 21.39% positive
Last year: 13,844; 28.99%
This year: 28; 0.1%
docs.google.com/spreadsheets/d…
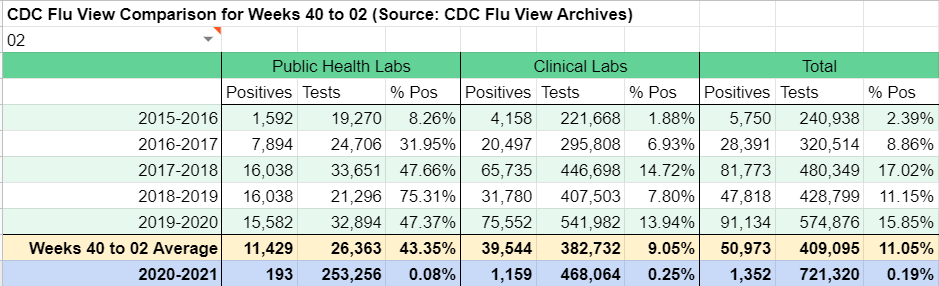
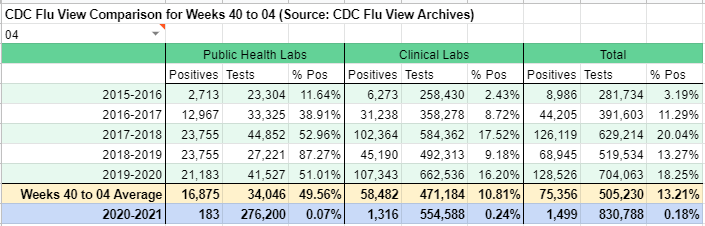
United States Influenza testing, season to date (18 weeks, MMWR 40 to 4)
Five-year average: 75,356 cases; 13.21% positive
Last year: 128,526; 18.25%
This year: 1,499; 0.18%
Five-year average: 75,356 cases; 13.21% positive
Last year: 128,526; 18.25%
This year: 1,499; 0.18%
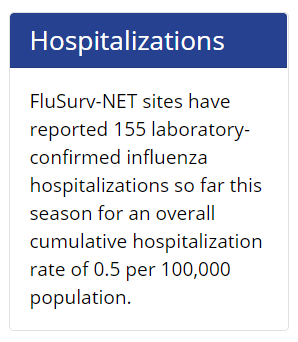
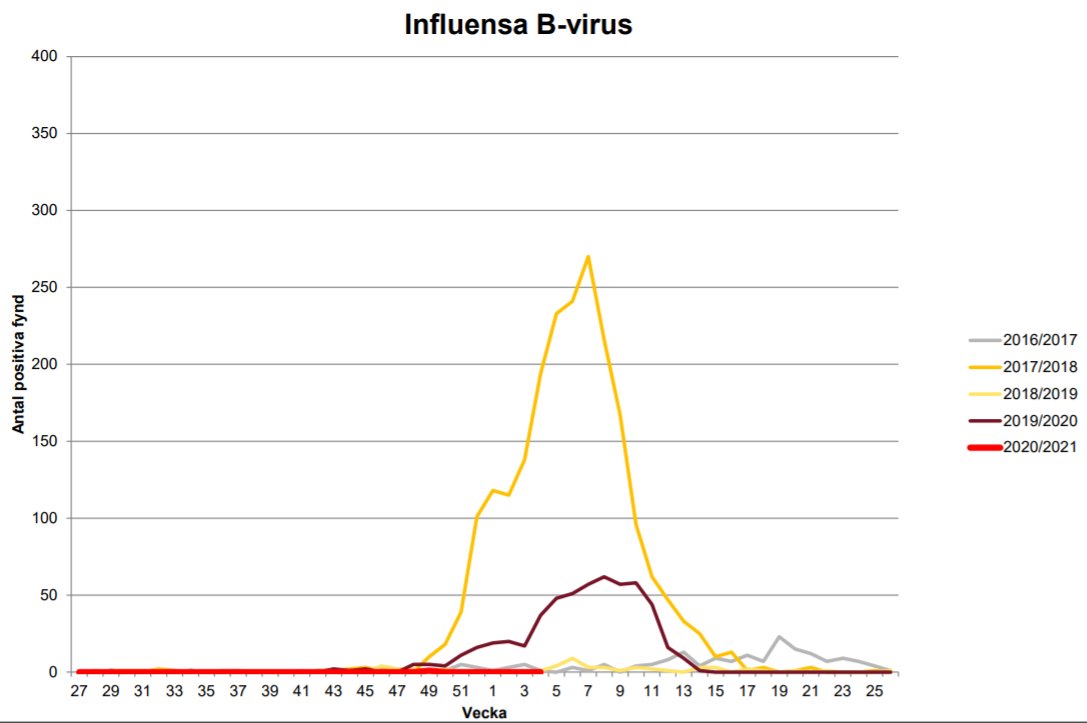
Season-to-date flu hospitalizations down 98.2% from last year.
Flu hospitalizations total (18 weeks) in FluSurv-NET is 155. Through week 4 last year (17 weeks) it was 8,633.
Rate last year: 29.7 per 100K
This year: 0.5 per 100K
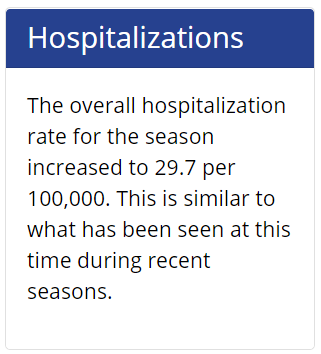
Flu hospitalizations total (18 weeks) in FluSurv-NET is 155. Through week 4 last year (17 weeks) it was 8,633.
Rate last year: 29.7 per 100K
This year: 0.5 per 100K
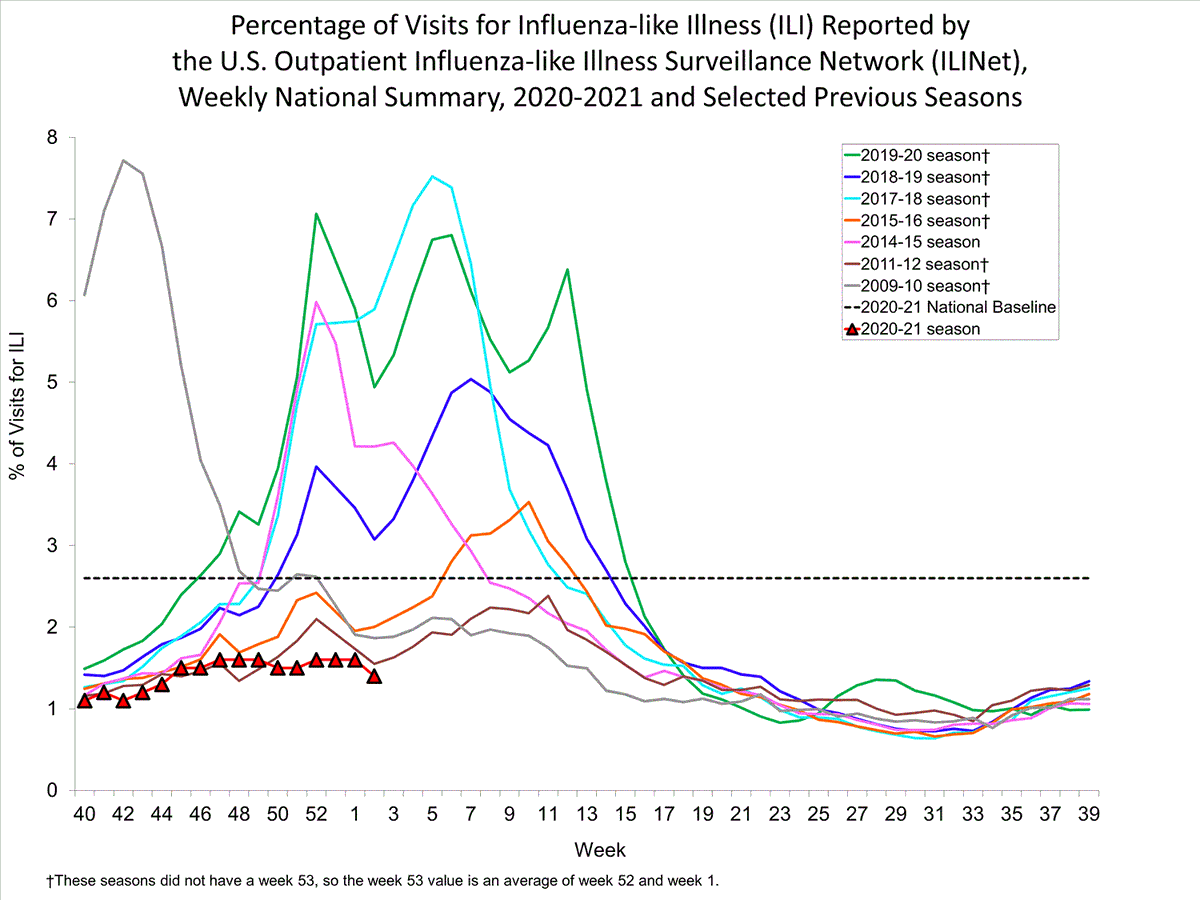
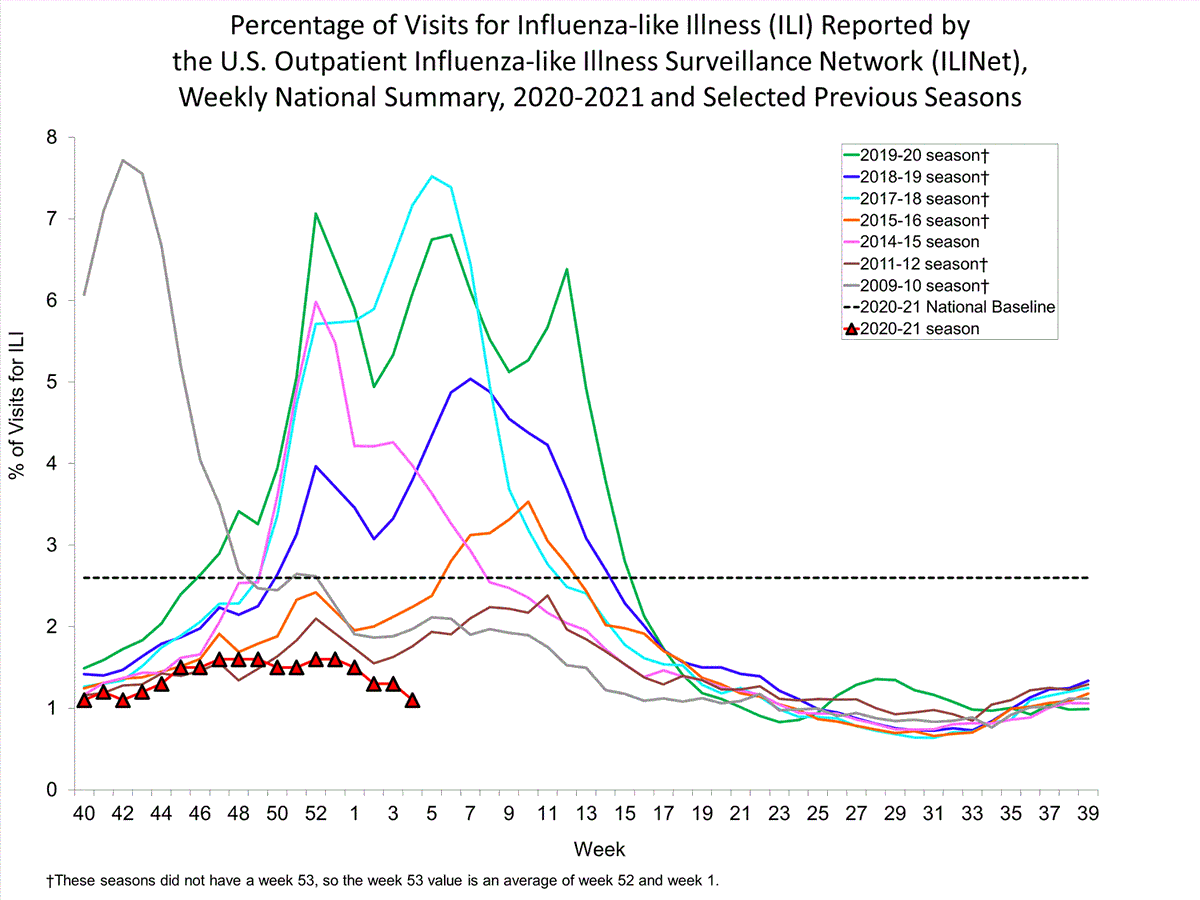
Influenza-Like Illness (ILI) continues to track lower than the mild 2015-16 and 2011-12 seasons, and is now declining when it was rising in those years.
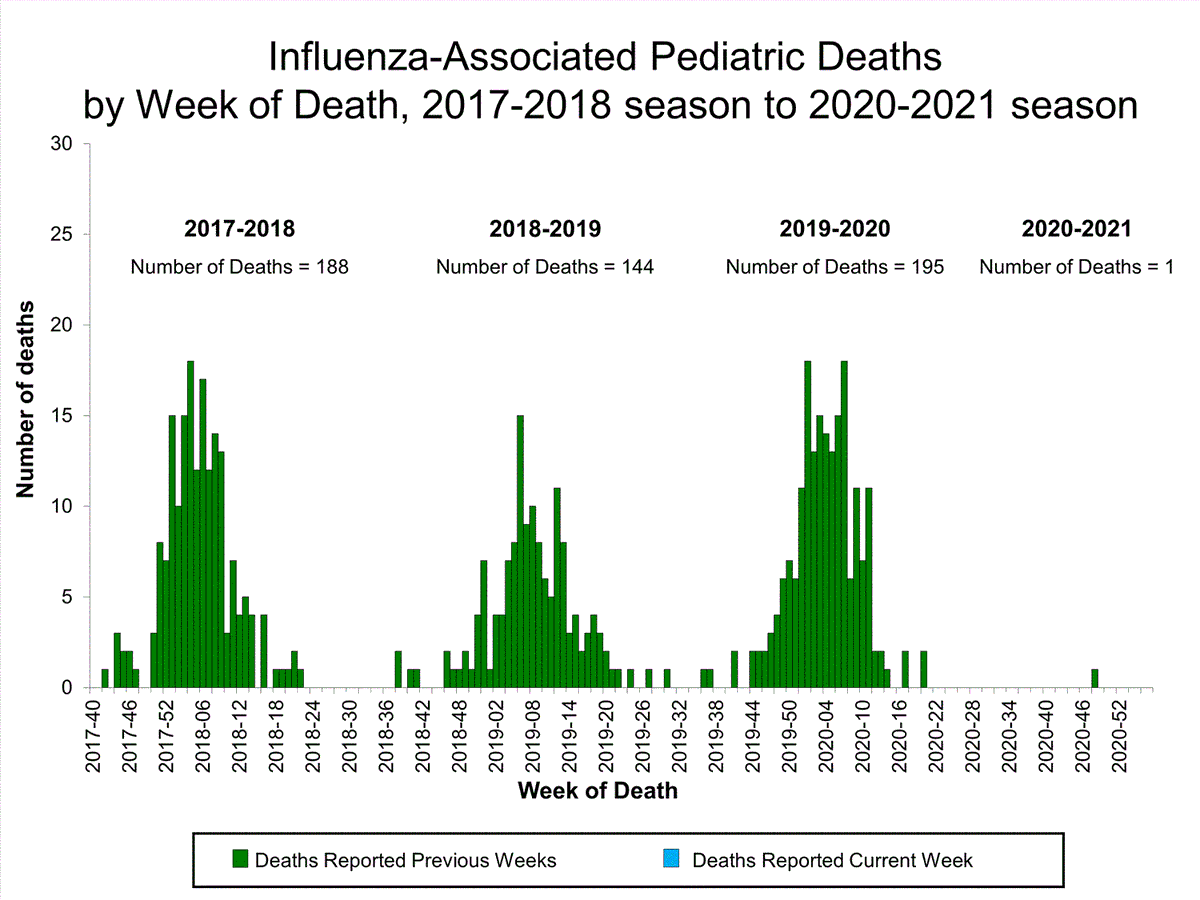
Still just one U.S. pediatric flu death this season.
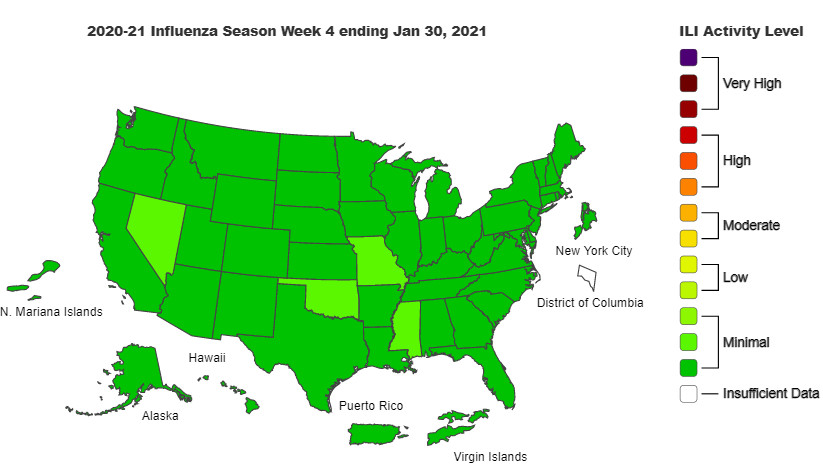
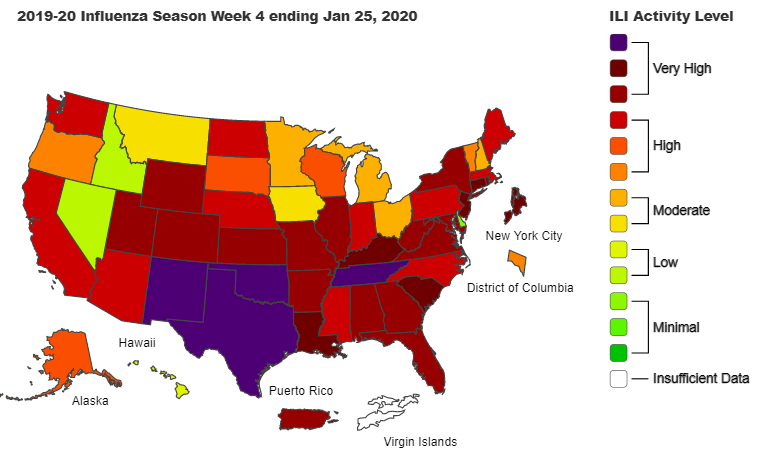
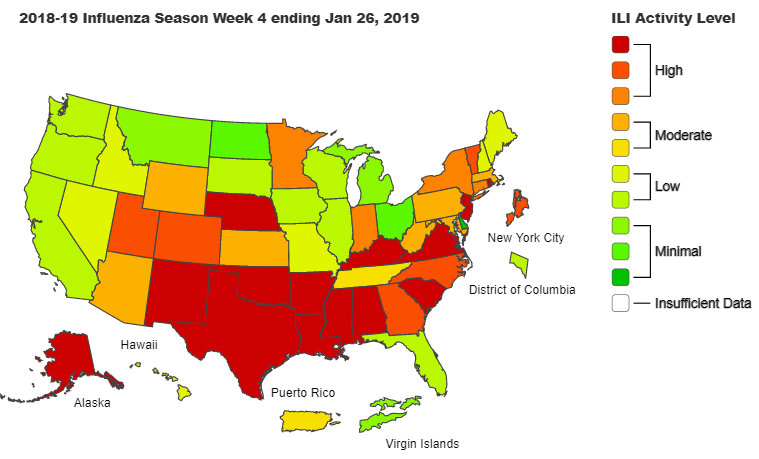
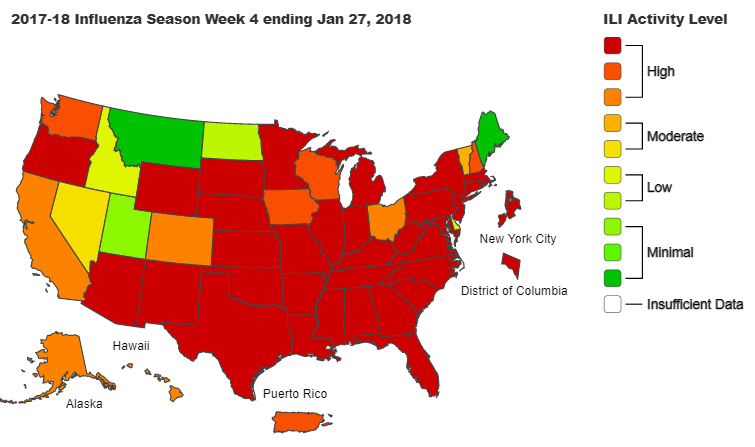
Influenza-Like Illness (ILI) Map
Week 4: 2021, 2020, 2019, 2018
Week 4: 2021, 2020, 2019, 2018
• • •
Missing some Tweet in this thread? You can try to
force a refresh