
These are rubbish. Thread: 1/n
https://twitter.com/ClareCraigPath/status/1362083587579904008
2/n First claim: the death rate numbers
True but misleading - it includes Jan-Mar 2020 with no Covid, and misses most of the second wave. This is a nightingale plot showing the weekly impact compared to every week from wk31, 1999
True but misleading - it includes Jan-Mar 2020 with no Covid, and misses most of the second wave. This is a nightingale plot showing the weekly impact compared to every week from wk31, 1999


3/n Death rates continued:
This bottom right shows how much of the second wave has been due to January and it's not finished yet.
This is also with lockdown
This bottom right shows how much of the second wave has been due to January and it's not finished yet.
This is also with lockdown

4/n Claim 2 - again true but misleading. The life expectancy at birth is not the same as at 80. The ONS has a handy calculator to illustrate this:
ons.gov.uk/peoplepopulati…
ons.gov.uk/peoplepopulati…

5/n Claim 3 - pre-existing conditions. There's a bit of a theme, with "true as far as it goes, but misleading out of context"
See list of pre-existing conditions (R) (thanks to @jayne_puligan for the graphic)
See list of pre-existing conditions (R) (thanks to @jayne_puligan for the graphic)


6/n Claim 4 - PCR test. This can be a whole thread of itself. But for starters, there's a very strong correlation between positive PCR cases and hospitalisations (graph thanks to @jneill)


7/n An aside about PCR tests and False positives. They are not an issue. In the last 14 days, there've been 361584 tests in NSW and Victoria, with zero positives.
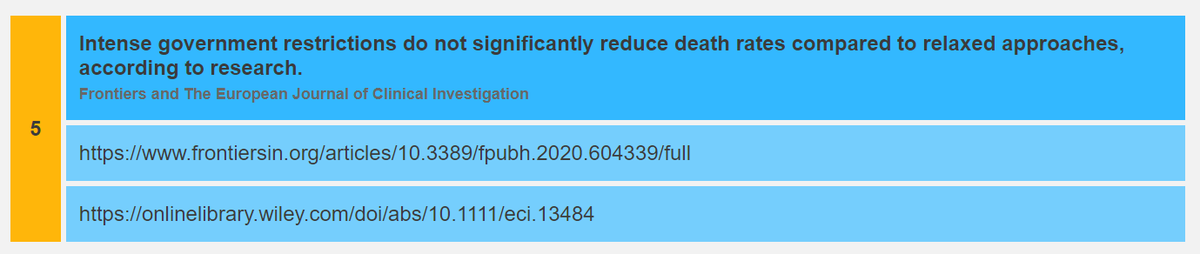
8/n
NPIs not impacting death rates according to research. Plenty more show they do.
And using data from Our world in Data - plotting cases, deaths, and restrictions/relaxations it is clear for England too
NPIs not impacting death rates according to research. Plenty more show they do.
And using data from Our world in Data - plotting cases, deaths, and restrictions/relaxations it is clear for England too
https://twitter.com/DFisman/status/1359121053134565381?s=20

9/n Claim 6 - lockdowns could cost more lives than Covid-19.
Implausible. The UK has had a 1.6% IFR in each of its waves so without lockdown buying time for the vaccine, we could have been looking at about a million dead. As it is, there's been 140,000 deaths.
Implausible. The UK has had a 1.6% IFR in each of its waves so without lockdown buying time for the vaccine, we could have been looking at about a million dead. As it is, there's been 140,000 deaths.
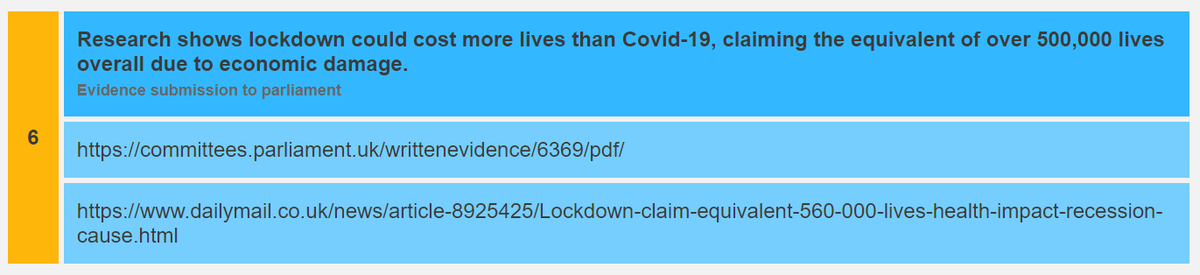
10/n Claim 6 cont. The economic cost of lockdowns will indeed cost lives. But letting Covid run rampant also has a huge economic cost. Letting 700,000 die of Covid, & 7-million get maimed would also have a huge economic cost & cost lives that way, as well as collapsed services
11/n Claim 6. Sweden famously doesn't have a lockdown (and its death data lags due to the way it reports it) This ↙️ is what 2020-21 looks like compared to the previous 5 years. Starting day is first day of a Covid death (Mar 10).
This is Norway since 2000 ↘️
This is Norway since 2000 ↘️


Claim 7 Natural infection is as good as vaccination at building up immunity.
Maybe - but vaccination doesn't kill 1.6% and maim 10% of those vaccinated. Nor does the vaccine infect others.
It's missing the point of the vaccine.
Maybe - but vaccination doesn't kill 1.6% and maim 10% of those vaccinated. Nor does the vaccine infect others.
It's missing the point of the vaccine.

13/n (12 wasn't numbered)
Claim 8.
This is the so-called Great Barrington Declaration, which is very fringe, and who are still counting the 7 Drs Harold Shipman, one Prof Ita Role allegedly a pudding expert (that I found) and lots of other joke signatories.
Claim 8.
This is the so-called Great Barrington Declaration, which is very fringe, and who are still counting the 7 Drs Harold Shipman, one Prof Ita Role allegedly a pudding expert (that I found) and lots of other joke signatories.


14/n Covid disproportionately affected those in Care homes.
I'm unsure why this is supposed to be important. Are their lives worth less?
I'm unsure why this is supposed to be important. Are their lives worth less?

15/n claim 10 - ONS downgraded its estimate of prevalence after justifying the second lockdown. Again, estimates change, &t late Dec-early Jan had huge pressure on hospitals - I've superposed the 2019-20 flu ICU rates on the 2020-21 Covid - graphs from: gov.uk/government/sta…


16/n claim 11 - The slide in question had "THESE ARE SCENARIOS NOT PREDICTIONS OR FORECASTS" in block capitals at the bottom. And there was lots of uncertainty shown in the slide.


17/n claim 11 - And again, with the trajectory at the time, the main problem with the second lockdown was that it was too late and too short, not that it was unnecessary.
18/n WHO PCR test document guidance changing. I'll leave this to @MackayIM - lots of other experts saying the same as well
https://twitter.com/MackayIM/status/1352962506466226177?s=20


19/n Claim 13 - Swab tests can produce nearly 100% false positive results. I can't see it in the links provided.
Three links - first two - the lower the Ct, the more likely of being infectious (very briefly)
The third - ↘️ REALLY hasn't anything relevant.
Three links - first two - the lower the Ct, the more likely of being infectious (very briefly)
The third - ↘️ REALLY hasn't anything relevant.


20/n - Claim 14 PCR tests are not sufficient to force people into quarantine rules a Portuguese court. This happened but judges and lawyers are not experts on science anymore than scientists are experts on law.

21/n Claim 15 - unlikely that lockdown caused the decline in the first wave.
A preprint server and the Spectator are not brilliant sources. And miss the point that it's not lockdown, but reducing contacts that's important. Google mobility trends show people were doing that ↘️
A preprint server and the Spectator are not brilliant sources. And miss the point that it's not lockdown, but reducing contacts that's important. Google mobility trends show people were doing that ↘️


22/n claim 16 another junk paper of a dubious organisation:
Which flatly contradicts the experience in many countries including the United Kingdom:
And especially New Zealand or Australia
Which flatly contradicts the experience in many countries including the United Kingdom:
And especially New Zealand or Australia


23/n claim 17 - social distancing across all the population prolongs deaths according to research (by prolonging the pandemic). By three people who are no more medics than me.
The rapid responses show the article has issues. For example It ignores the impact of vaccine rollout.
The rapid responses show the article has issues. For example It ignores the impact of vaccine rollout.

24/n claim 18 - Restrictions might need to last through 2021.
I'm not sure what the point of this claim is - or how it argues either for or against restrictions
I'm not sure what the point of this claim is - or how it argues either for or against restrictions

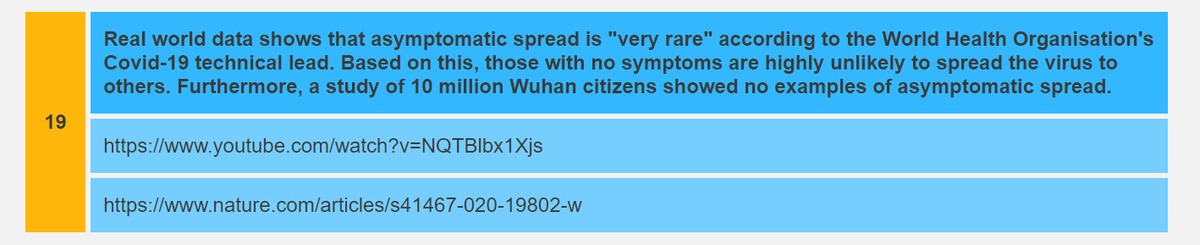
25/n Asymptomatic spread is very rare. Oh goody YouTube video (I'll give that a miss). The nature article looks good but:
There is a difference between asymptomatic, mildly symptomatic, and pre-symptomatic. And you cannot determine which in many situations
/End
There is a difference between asymptomatic, mildly symptomatic, and pre-symptomatic. And you cannot determine which in many situations
/End
@threadreaderapp unroll

• • •
Missing some Tweet in this thread? You can try to
force a refresh


