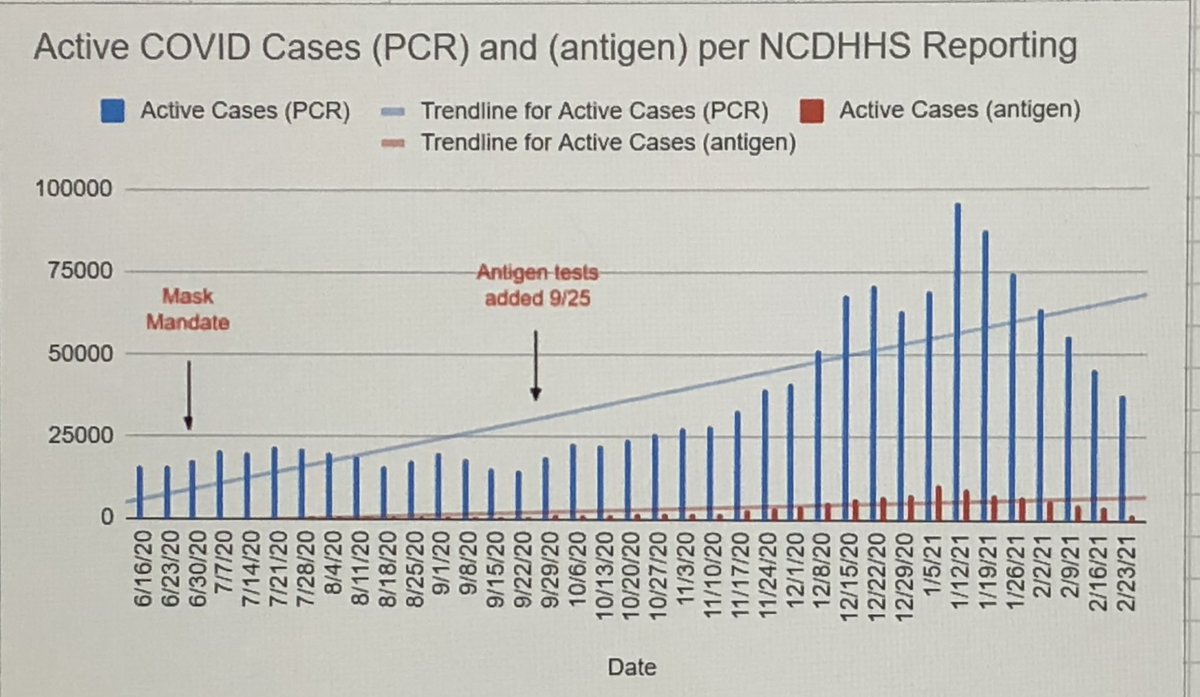
1/ @APDillon_ @JohnLockeNC @PeteKaliner @Chad_Adams @jonpsanders NC SC-2 Trends thru 1/26/21 including current data on graphs to show how things are trending in real time. Discussing thru 1/26 since NCDHHS consistently modifies their dashboard (drives incidence down).
2/ Overall incidence ⬆️ for 11th wk to 8.47% (⬆️ 0.04%). Overall incidence has never been at 5% since testing began; no statistically significant change since the mask mandate. 

3/ Daily incid b/w 6.5% & 17.1% (reporting inconsistency; see graph) last 14 days. Avg daily incid (1/1-26) =12.5% (⬆️ 1.6% compared to Dec, stat sig). Avg daily incid each month:
May: 6.8% June: 7.6% July: 8.1%
Aug: 6.9% Sept: 5.7% Oct: 6.4%
Nov: 7.4% Dec: 10.9% 1/1-26: 12.5%
May: 6.8% June: 7.6% July: 8.1%
Aug: 6.9% Sept: 5.7% Oct: 6.4%
Nov: 7.4% Dec: 10.9% 1/1-26: 12.5%

4/ Avg wkly incid =11.01%. After mask mandate, avg wkly incid fluctuated significantly despite reported mask compliance ~90%. Avg wkly incid last 3 wks =11.86%. Avg wkly incid:
May: 6.9% June: 7.4% July: 8.1%
Aug: 7.4% Sept: 5.7% Oct: 6.3%
Nov: 6.9% Dec: 10.6% 1/1-1/26: 12.4%
May: 6.9% June: 7.4% July: 8.1%
Aug: 7.4% Sept: 5.7% Oct: 6.3%
Nov: 6.9% Dec: 10.6% 1/1-1/26: 12.4%

5/ 1/26 rolling 14-day incid avg =11.05%. After mask mandate, rolling 14-day incid fluctuated significantly despite reported mask compliance ~90%. Rolling 14-day avg:
May: 6.7% June: 7.6% July: 7.9%
Aug: 7.3% Sept: 5.9% Oct: 6.2%
Nov: 6.95% Dec: 10.2% 1/1-26: 12.7%
May: 6.7% June: 7.6% July: 7.9%
Aug: 7.3% Sept: 5.9% Oct: 6.2%
Nov: 6.95% Dec: 10.2% 1/1-26: 12.7%

6/ # active cases (82,040) ⬇️d 2nd consec wk. I think we’ll see ⬇️ in cases starting in Feb, (consistent w/flu/PNA. Nov-Feb usually busiest months in hospitals. Avg # of new cases/day:
May: 583 June: 1164 July: 1859
Aug: 1498 Sept: 1352 Oct: 2065
11/20: 2996 Dec: 5946 Jan: 7032

May: 583 June: 1164 July: 1859
Aug: 1498 Sept: 1352 Oct: 2065
11/20: 2996 Dec: 5946 Jan: 7032


7/ # of tests ⬆️ 13.28% over Dec. I expect Jan test #’s to ⬆️; NCDHHS back fills data; currently tests can be back filled 1/24 to present.
May: 281,133 June: 348,174
July: 714,289 Aug: 699,911
Sept: 773,697 Oct: 1,037,783
Nov: 1,242,860 Dec: 1,673,424
Jan: 1,895,683
May: 281,133 June: 348,174
July: 714,289 Aug: 699,911
Sept: 773,697 Oct: 1,037,783
Nov: 1,242,860 Dec: 1,673,424
Jan: 1,895,683
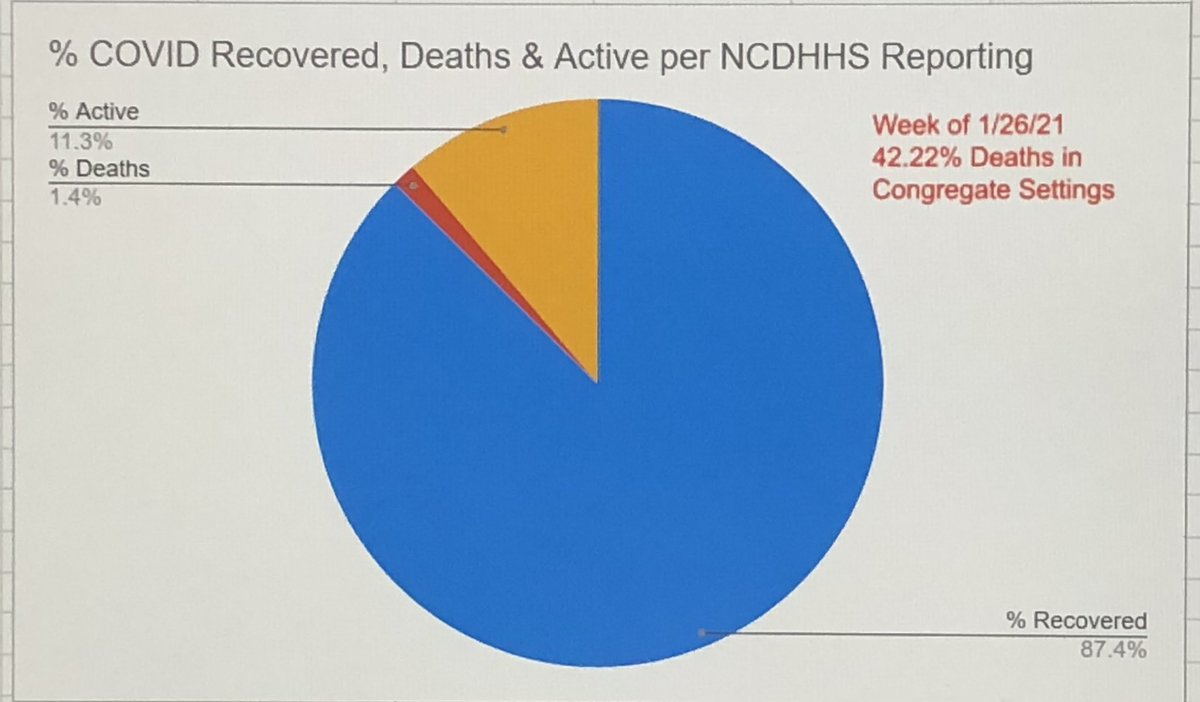
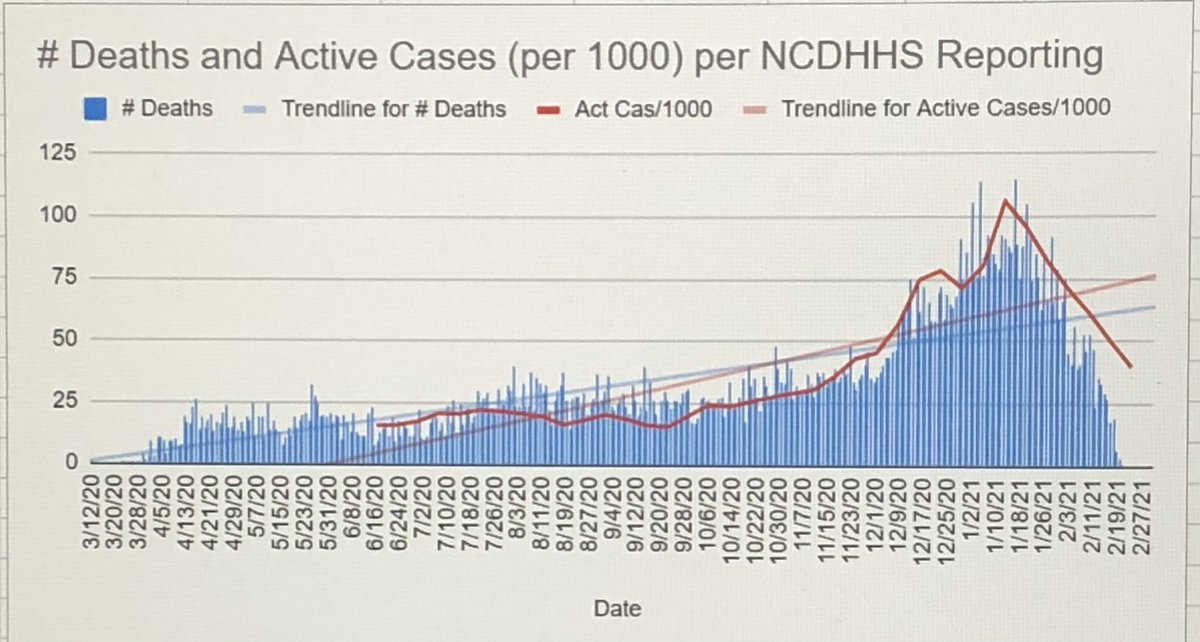
8/ % recovered =87.4%, % active cases =11.3%, % deaths =1.36%. CFR unchanged. Mortality rate ⬆️ to 0.094% (expected). Avg # deaths/day ⬆️ in Jan:
March: 0.85 April: 14.37 May: 18
June: 15.23 July: 21.06 Aug: 28.68
Sept: 26.33 Oct: 28.68 Nov: 35.6
Dec: 61.48 Jan: 84.29

March: 0.85 April: 14.37 May: 18
June: 15.23 July: 21.06 Aug: 28.68
Sept: 26.33 Oct: 28.68 Nov: 35.6
Dec: 61.48 Jan: 84.29


9/ 0-17 & 18-24 cohorts, where 13 deaths reported out of 190,570 total cases (CFR = 0.00682%) since 6/15. Conversely, 15% of NC COVID cases (119,178) are in 65-75+ cohort, & 83% of all NC COVID deaths (8,769) are in this cohort; of these 42.22% have been in congregate settings.
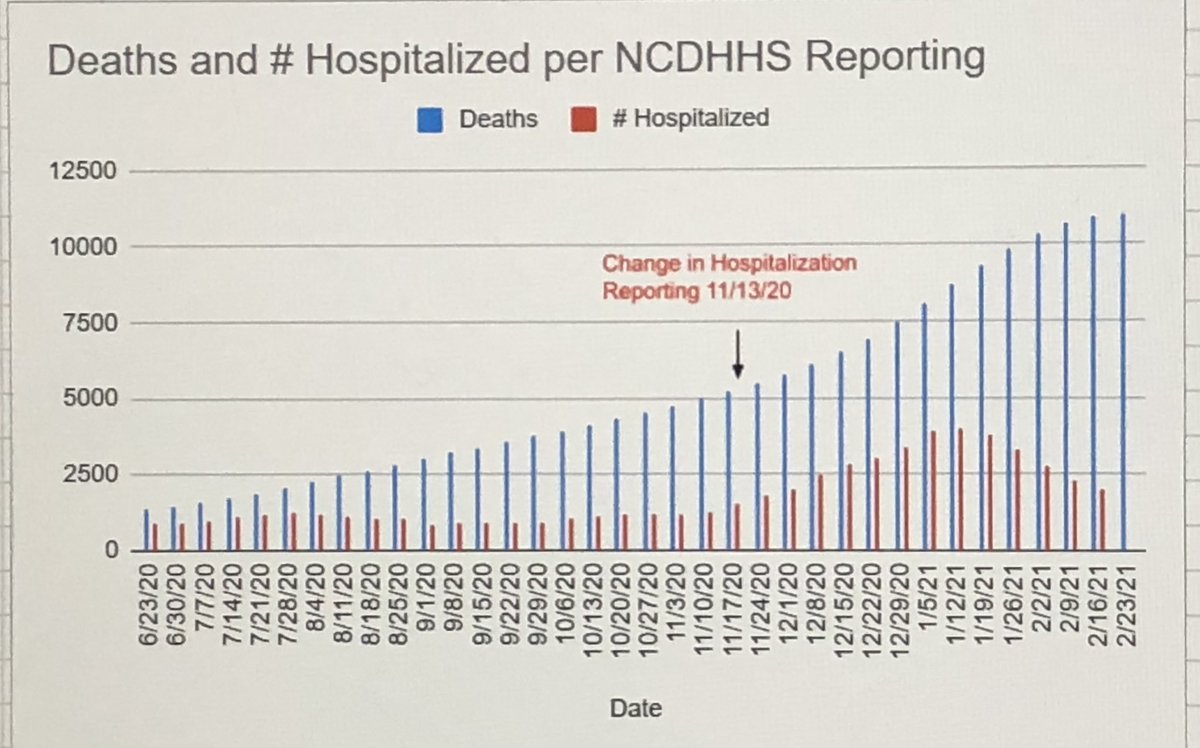
10/ Hospitalizations ⬇️ by 471 pts to 3305. NOTE: on 2/25/21, vent avail capacity =74%, ICU avail capacity =21.4% at worst/45% at best; inpatient bed avail capacity =25% at worst/38% at best. Duke region most affected w/ICU beds, (9 empty staffed, ⬇️ 5). 

11/ % change in active cases/tests/incidence ⬇️ for 2nd consecutive wk; very good sign! WCPSS reported 53 cases 1/20-26 (30 students/23 staff) while on remote only. Private/charter schools report 38 cases (29 students/9 staff). 

12/ Covid cases per cohort ⬇️‘d across all age groups. Main cohort drivers of transmission are 25-49, 50-64, & 18-24 yrs. 5,894 active cases in 50-64 cohort & 10,700 in 25-49 cohort (total = 16,594), & 7,208 active cases COMBINED in 2-24 cohort. This is in ALL of NC. 

13/13 Overall, average daily incidence, and average deaths/day all ⬆️. Average weekly/rolling 14-day incidence, active cases, hospitalizations, and daily cases, all ⬇️. Hospital capacity is no longer an issue.
• • •
Missing some Tweet in this thread? You can try to
force a refresh


