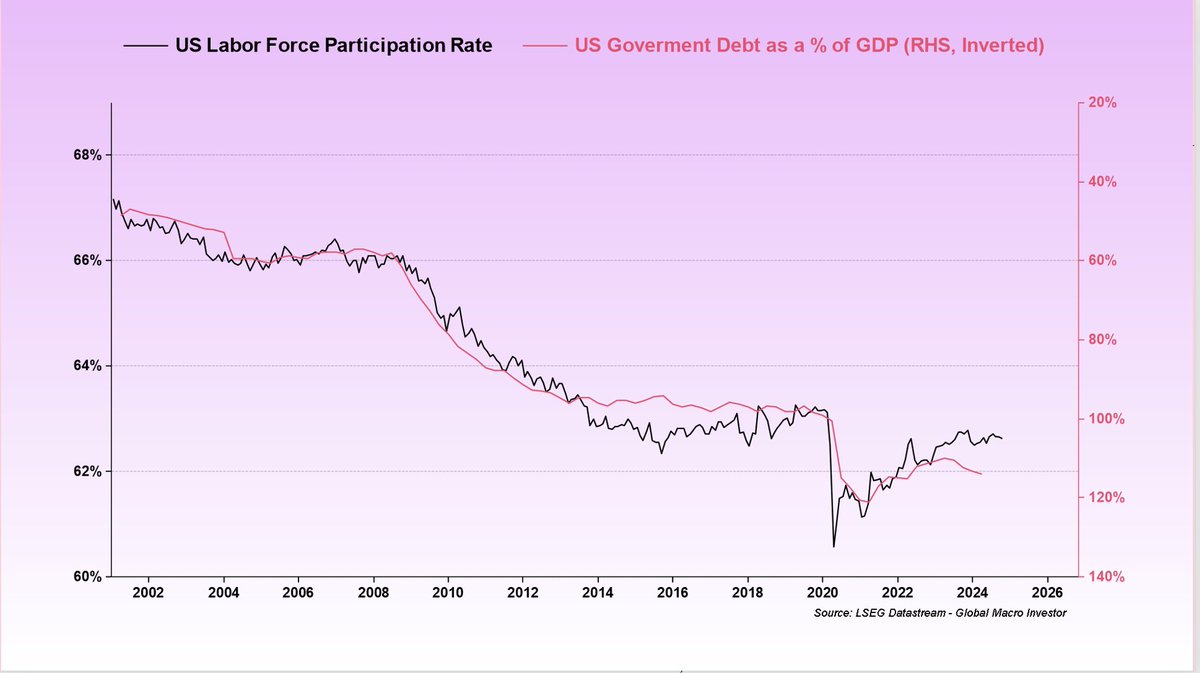
Im doing a lot of thinking around currency debasement and how to measure it. You see, I think everyone looking for it to appear in CPI inflation is likely to be frustrated due to the lack of wage inflation, debt, demographics, technology and globalisation.
We know there is asset price inflation, cause by the printing of money. Here is MSCI World Equity Index. +263% since QE started in 2008. 

But when we change the denominator to the G4 Central Bank Balance sheets, we can see that equities have traded sideways since 2008, basically counteracting the balance sheet expansion (and are probably cheap currently as 0.15 appears to be the mean) 

The S&P shows similar versus the Fed Balance Sheet but are roughly at fair value and essentially just counteract the Fed Balance Sheet growth (and suggests Non-US equities are cheaper). 

But how do you measure the actual drop in value of global currencies?
Everyone makes the mistake of looking at the dollar index, but ALL fiat is being debased. The DXY has essentially traded sideways with a slight upward bias since 2008. It is NOT a dollar story.
Everyone makes the mistake of looking at the dollar index, but ALL fiat is being debased. The DXY has essentially traded sideways with a slight upward bias since 2008. It is NOT a dollar story.

When I look at a basket of 27 currencies versus the dollar (equally weighted). They have underperformed in the dollar bull market, but only by a bit since 2008. 

But when I look at gold vs a basket of 27 currencies (thus stripping out the dollar denominator), it shows that they have declined by 60% versus the longest-used store of value in history. This IS debasement. 

When we look at that basket of currencies versus the balance sheet, they also show an even larger decline (dollar outperformance + debasement) 

But gold itself has not really help preserve wealth as well as it should have done. Im not sure why that is, but versus the G4 BS (applicable short hand in this case!) it has fallen significantly -60% in BS terms... 

Even Real Estate, which is another traditional store of value, has also failed to offset the devaluation of Fiat. 

Bitcoin has obviously massive outperformed the G4 BS and is not only a store of value, but a huge wealth generator too and should continue to do so even taking into account the negative side of the halving cycles. 

The only other key asset that has generated wealth are technology stocks. In this secular super cycle of technology, they have outperformed the Fed BS by 220% 

That makes total sense considering we are in the Technology Age and the pace of innovation and disruption of old industries is blistering and exponential.
So, what does this all mean?
We are looking at the wrong denominator for assets, as I have suggested before.
Broad based equities and Real Estate have trodden water since 2008, which makes total sense. To me it confirms the truthiness of this much used chart of Fed BS v SPX.
We are looking at the wrong denominator for assets, as I have suggested before.
Broad based equities and Real Estate have trodden water since 2008, which makes total sense. To me it confirms the truthiness of this much used chart of Fed BS v SPX.

Equities will climb as the balance sheet climbs.
They will continue to offset currency debasement.
Tech will outperform over time. EM too, most likely.
Fiscal + YCC will increase the BS, so equities over time will likely rise in dollar terms (but not BS terms).
They will continue to offset currency debasement.
Tech will outperform over time. EM too, most likely.
Fiscal + YCC will increase the BS, so equities over time will likely rise in dollar terms (but not BS terms).
It suggests Real Estate has not been a great store of value overall.
Gold is suffering a similar fate, which is frustrating a lot of people, but my guess it will mean revert in due course and stabilise in SoV terms.
Gold is suffering a similar fate, which is frustrating a lot of people, but my guess it will mean revert in due course and stabilise in SoV terms.
But It really suggests that technology investments and above all, Bitcoin (and my guess ALL digital assets) are going to continue to suck in all the worlds capital, over time, as people realise it is the most efficient way to generate wealth over and above their store of value.
Im just thinking out loud but I think that we are looking at the wrong denominator and when we look at it in central bank balance sheet terms, the world makes a lot more sense and gives us clues how to allocate capital to create and preserve wealth.
• • •
Missing some Tweet in this thread? You can try to
force a refresh


