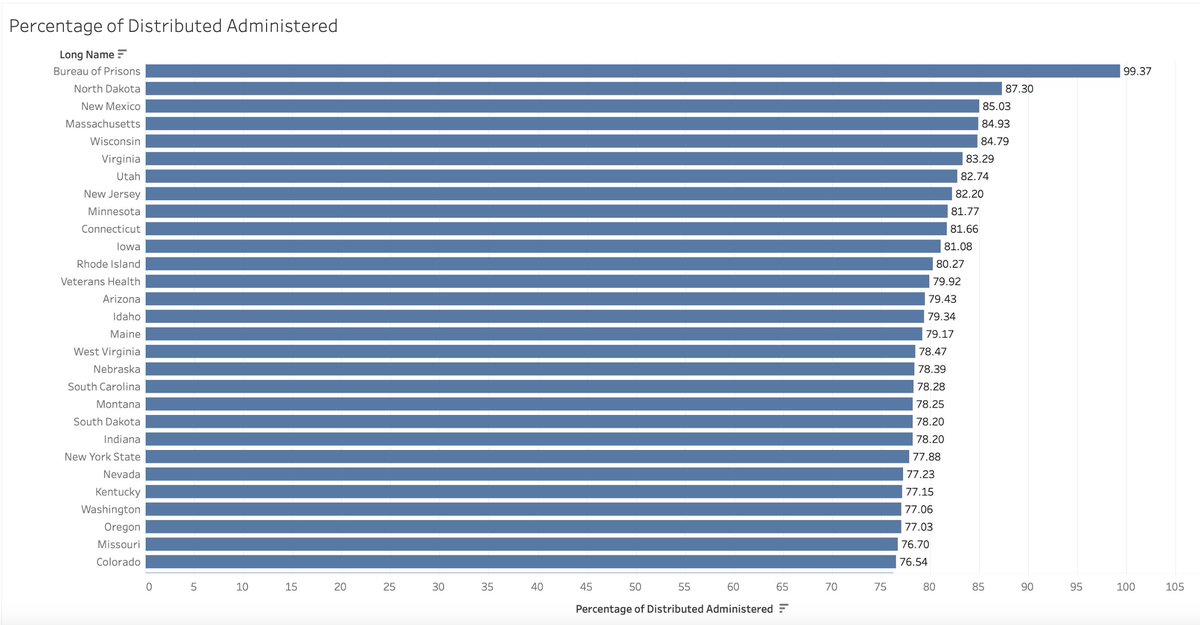
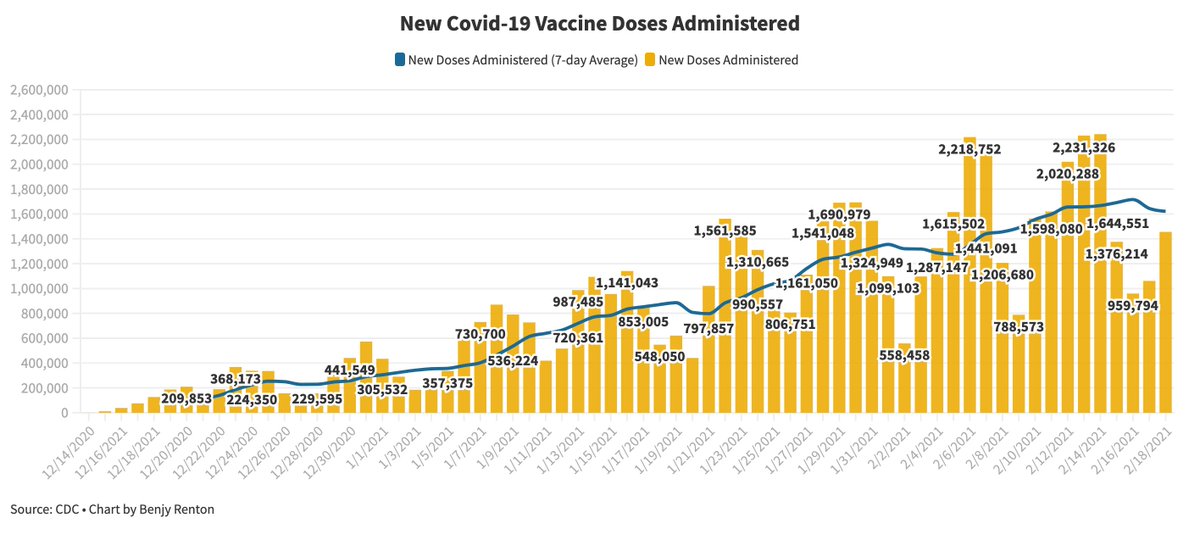
North Dakota leads the nation with 87.3% of shots used. The percentage of supply used is merely one metric to compare states, and soon the dashboard will have more metrics for you to use. The 7-day average is now 2.17 million doses per day.
15.7 million doses of Pfizer and Moderna doses have been allocated for jurisdictions next week. The dashboard has been updated with the latest allocations.
It's important to note that each state has different population characteristics that could affect the speed of its vaccination rollout. For example 7.5% of residents in Alaska are over the age of 70, compared to 13.4% in Vermont. State governments often know what is best.
This is not necessarily endorsing a particular state's strategy. Rather, it is stating the fact that states are allocated doses based on its general adult population, not according to each state's individual strategy. States using an aged-based system may take…
…longer to move through age bands, particularly if the average age is older than other states. Additionally, vaccine uptake plays a huge role — some states have ensured high uptake in each group before moving on to the next one.
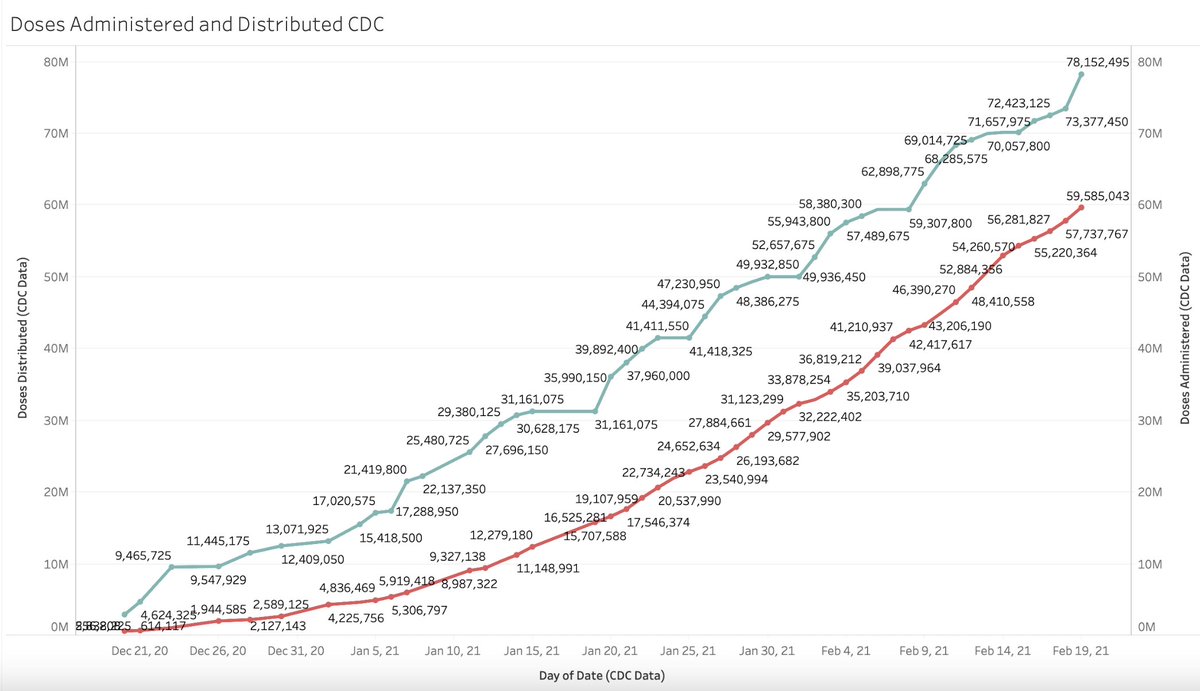
Will post more data in the coming days detailing how severe weather is affecting vaccine deliveries, as the White House announced today 6 million doses are backlogged and will be shipped very shortly. Deliveries and reporting systems are recovering — look at the green uptick.
North Dakota now leads the nation with 95% of shots used. This number will drop for all states as supply is replenished.
Just over 21,000 vaccine doses were reported administered in Texas in the last 24 hours, the latest in a series of fallbacks after severe weather has disrupted vaccination sites and reporting systems. The number of doses allocated to the state has not changed in 3 days.
In the last 24 hours, 46% of counties reported fewer than 10 doses administered. Compared with last Thursday, almost all counties are reporting fewer new doses administered by a large margin. It may take days for the infrastructure to recover and reporting to catch up.
"Any delays, the timing could not be worse," @PeterHotez said on @CNNTonight last night.
New Mexico leads the nation with 100.4% of delivered doses administered — this is most likely due to the counting of the sixth dose in Pfizer vials. The 7-day average is 1.62 million doses/day.
Many states did not report deliveries of doses due to severe weather.
Despite case counts subsiding nationally, many colleges and universities are seeing record-high case counts and multiple outbreaks, with some eclipsing fall semester case totals. While we have learned a lot from the fall, there are still additional measures we can take. Thread:
The universities selected for this analysis were chosen due to their recent attention in college media (in other words, there's no particular pattern for selection). From this table, we notice that colleges have been reaching case peaks ~14 days after the start of classes.
What does this mean? Based on the virus' incubation period and national transmission, we can assume that cases are imported when students return to campus. However, the vast majority of spread occurs when these imported cases spread to others within the first few days of class.
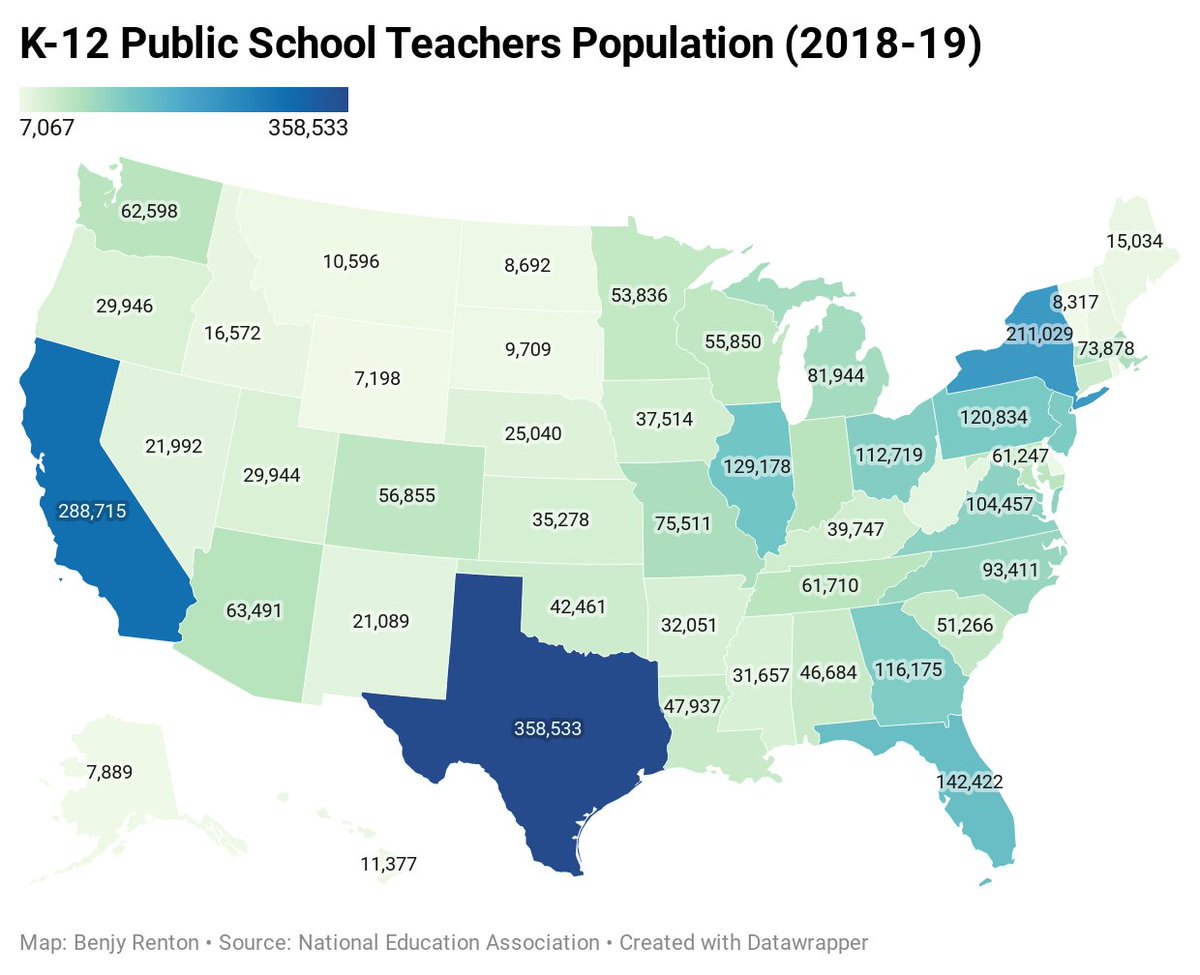
Vaccinating all teachers and safely reopening schools in April: @JReinerMD posted this tweet earlier in the day on the idea to use the first batch of the Johnson & Johnson vaccine to vaccinate all teachers. Short thread on the numbers and science:
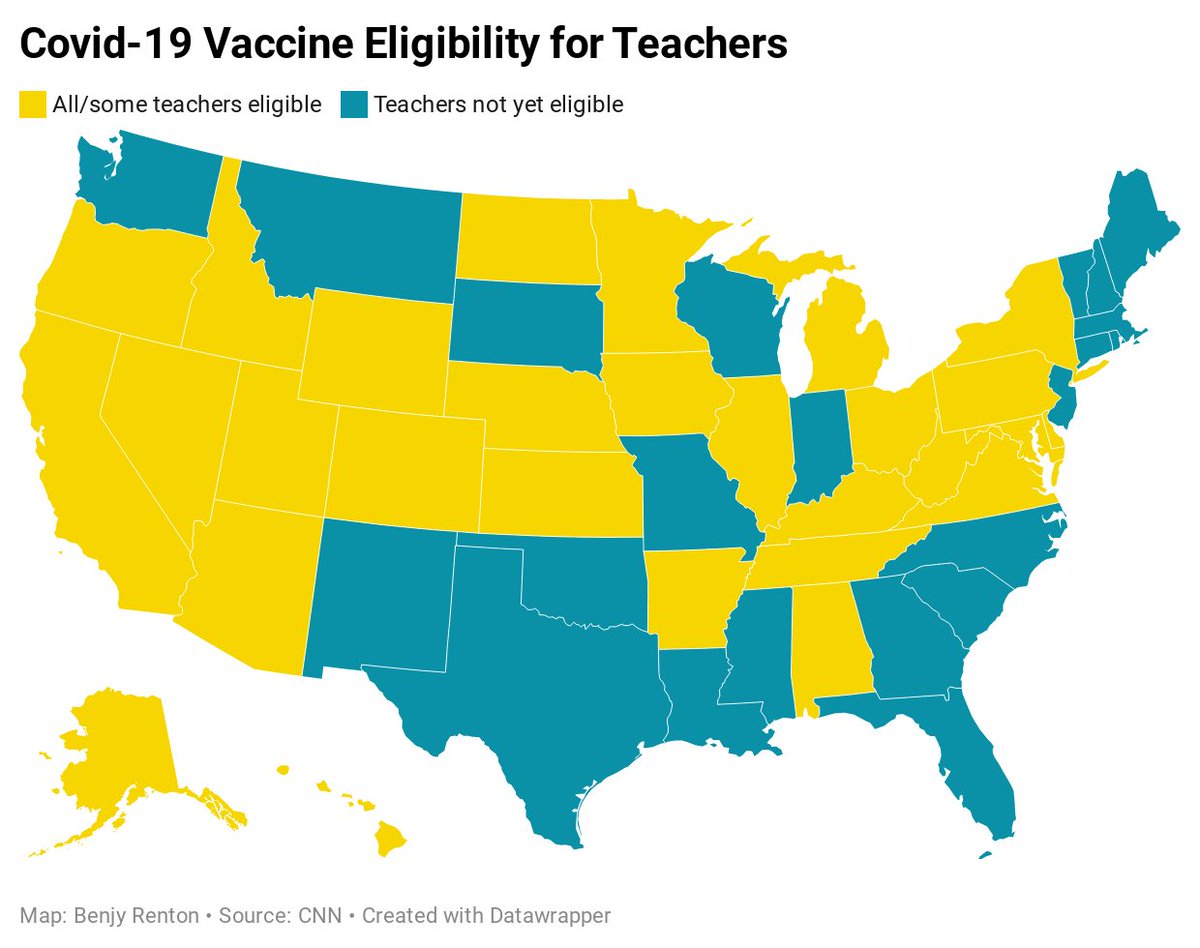
While the CDC does not see vaccinating teachers as a prerequisite for reopening schools, @DrLeanaWen, @PeterHotez, and others have pushed for all teachers to be vaccinated. Today's @CNN analysis showed in 29 states all/some teachers are currently eligible.
Recent studies have shown that if precautions are followed, in-school spread is low, assuming schools invest in safety measures and community transmission is low. @meganranney has a great thread on the science here.