Ivan Akulov Profile picture
Mar 18, 2021 11 tweets 7 min read Read on X
Thread of my favorite web performance tools 🚀
1) slowfil.es by @csswizardry and @RyanTownsend gives you a URL with a huge (and customizable) server response time.

Super convenient to test what happens when a CSS or JS files takes forever to load. Image
2) input-delay.glitch.me by @notwaldorf shows how it feels to have a laggy input field. (It’s the most irritating tool ever.)

bl.ocks.org/esjewett/2b188… by @esjewett does the same – but for mouse cursor.

Both tools are 💯 for demos. Image
(Semi-related: a 3-minute Microsoft video that shows how *huge* a difference between a 100 ms latency and a 5 ms latency feels.)
3) statoscope.tech by @smelukov is a modern version of webpack.github.io/analyse/. A bit less detailed, but so much nicer!

My primary use case: drop a webpack stats file → see why exactly that specific huge file is bundled. Image
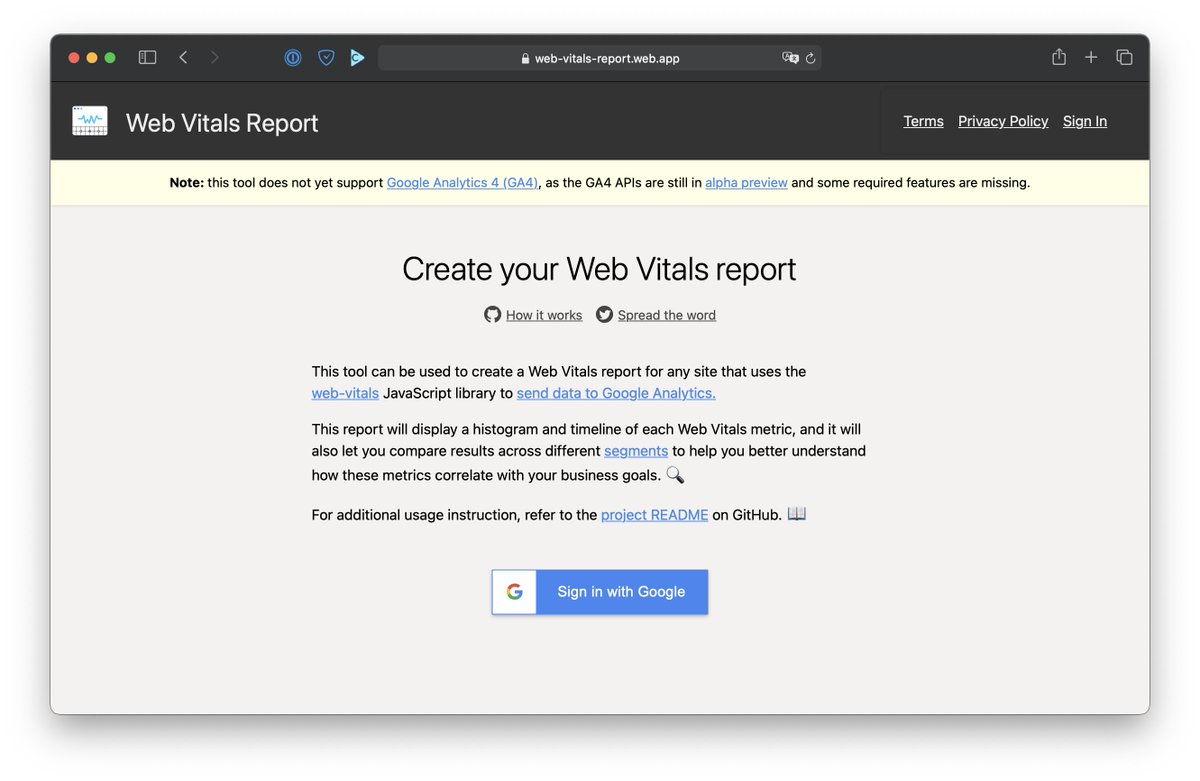
4) web-vitals-report.web.app builds a Core Web Vitals report based on your Google Analytics data (but you need to send CWV data into GA explicitly).

Haven’t had a chance to use it yet (don’t collect CWV data with GA), but should be a great helpful tool for some clients. Image
5) Also, datastudiohelp.com/core-web-vital… explains how to get a Core Web Vitals report in Google Data Studio. (It’s actually quick! Just clone a template and change the url.)

Unlike with the previous tool, you don’t need to collect any data yourself! The report uses CrUX data. Image
6) usehooks.com/useWhyDidYouUp… is a React hook that prints why a specific component rerendered. Just copy and paste it! Perfect for debugging runtime performance of a single component 💅

Like github.com/welldone-softw…, but much less invasive. Image
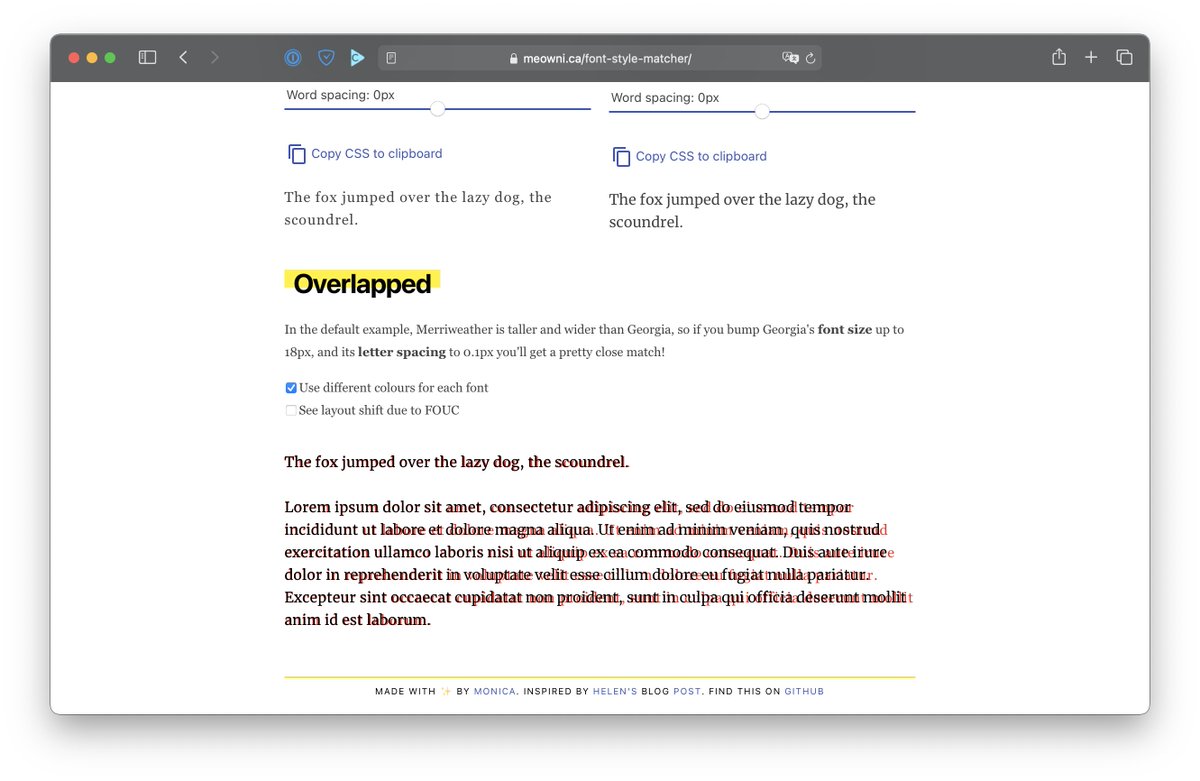
7) meowni.ca/font-style-mat… (yet another tool by @notwaldorf!) lets you find a fallback font that matches your custom font as closely as possible.

If you ever had a high CLS score because the layout jumped after a custom font loaded, this is for you. Image
(Oh, and shameless plug: in addition to these tools above, I also have a GitHub list with 50+ webpack performance tools and plugins: github.com/iamakulov/awes…) Image
8) glyphhanger, which makes fonts smaller by removing any characters your page doesn’t need (and more). And it’s a one-line command!

Image

• • •

Missing some Tweet in this thread? You can try to force a refresh
 

Keep Current with Ivan Akulov

Ivan Akulov Profile picture

Stay in touch and get notified when new unrolls are available from this author!

Read all threads

This Thread may be Removed Anytime!

PDF

Twitter may remove this content at anytime! Save it as PDF for later use!

Try unrolling a thread yourself!

how to unroll video
  1. Follow @ThreadReaderApp to mention us!

  2. From a Twitter thread mention us with a keyword "unroll"
@threadreaderapp unroll

Practice here first or read more on our help page!

More from @iamakulov

May 24, 2023
How I typically test performance (a thread for a client who asked about this):
1️⃣ When I’m optimizing Core Web Vitals, I typically focus on LCP and CLS. LCP is roughly “how quickly the page renders”, CLS is “how much the page jumps during loading”.

I don’t normally focus on FID because it’s almost always green (but that will change next year). Image
2️⃣ When I’m profiling LCP, I like to work through WebPageTest.org (WPT).

Why WPT:
• Their network throttling is more accurate than Chrome’s (github.com/GoogleChrome/l…)
• And their CPU throttling is stable (vs. my laptop which can be faster or slower)
Read 20 tweets
Apr 5, 2023
Ever read an article that says “setTimeout(..., 0) fires not in 0 ms but in 4”? This is no longer true – at least not in Chrome and Safari, and not since a few months ago.

But getting there was a bit of a bumpy road. Image
1) The HTML spec tells that `setTimeout()` calls nested 5+ levels deep must be throttled to 4 ms. This prevents poorly written sites from over-consuming CPU.

(Note the word “nested” – unnested `setTimeout()`s were never intended to be throttled! But we’ll get to that in a bit.) Image
Browsers generally adhere to this spec.

However, in 2022, Chromium noticed that bumping the nesting limit from 5 to just 7 improves the Speedometer score by 10%. chromestatus.com/feature/571069… Image
Read 12 tweets
Jun 15, 2022
Gah I’m really excited about <Suspense> and hydration in React 18.

With React 16-17, `.hydrate()` is often the most expensive JS call in the whole app. You start hydrating the app – and the page freezes for, like, a second: Image
In React 18, `.hydrate()` is still expensive by default.

But! If you wrap parts of the app (or the whole app) with <Suspense>, React will take these parts – and instead of hydrating them in one go, will hydrate them in chunks, 5-10 ms at a time: Image
Under the hood, React uses performance​.now() and isInputPending() APIs to check how long rendering takes. If rendering takes more than 5-50 ms, or if isInputPending() returns `true`, React pauses rendering and yields to the browser.

Here’s how the check is implemented: Image
Read 5 tweets
May 5, 2022
Oh look, my favorite app Spotify being slow!

Also it’s 1 am meaning it’s the best time to do some performance profiling.

Thread ⬇️
Spotify is an Electron app, meaning we can use Chrome DevTools to profile it. To enable Chrome DevTools in Spotify, I install `spicetify` and run `spicetify enable-devtools`.

Yay!
Now, let’s go to Chrome DevTools → Performance → Record, switch between playlists a couple times, and stop the recording. This is what we’ll get ↓

What can we see here?
Read 16 tweets
Nov 25, 2020
Okay, let’s talk about reexports – and why they’re bad for loading and runtime performance.

Thread ⬇️ A screenshot of a file call...
A pattern I see pretty often is when a single file re-exports stuff from lots of other files.

If your project has a `components/index.js` file which re-exports all your components (and does nothing else), that’s one example.

This is bad for performance – for two reasons.
1) It makes code splitting ineffective.

When you do

import { Button } from './components'

you’re importing not only Button but the whole ‘./components’ file. Which means you’re *bundling* the whole file – with all the components it exports.
Read 10 tweets
Oct 5, 2020
One of the reasons your Lighthouse score might be bad is third parties.

Many (not all, though!) third parties execute a lot of JavaScript. This blocks the main thread & worsens your JS-related Lighthouse metrics (TTI/TBT).

Here’re several ways to optimize them – a thread ⬇️
1) Check if all third parties are needed

Sometimes, we add an analytics script, experiment with it, and then forget to remove it.

Go to DevTools → Network, filter away your domain, then go over “Domains” and see if there’s anything you (or the marketing team) don’t recognize. Image
2) Use a timer

Some third-parties can be delayed without hurting the business. Eg marketing is often fine with delaying Facebook Pixel – they don’t care about retargeting to users that spent less than 10s on the site.

In this case, just tune the script code to use a timer: Image
Read 10 tweets

Did Thread Reader help you today?

Support us! We are indie developers!


This site is made by just two indie developers on a laptop doing marketing, support and development! Read more about the story.

Become a Premium Member ($3/month or $30/year) and get exclusive features!

Become Premium

Don't want to be a Premium member but still want to support us?

Make a small donation by buying us coffee ($5) or help with server cost ($10)

Donate via Paypal

Or Donate anonymously using crypto!

Ethereum

0xfe58350B80634f60Fa6Dc149a72b4DFbc17D341E copy

Bitcoin

3ATGMxNzCUFzxpMCHL5sWSt4DVtS8UqXpi copy

Thank you for your support!

Follow Us!

:(