Ivan Akulov Profile picture
Web perf engineer @ Framer. Prev. web perf consultant (Google, Appsmith, Toggl, etc). Getting React interactions 2-4x faster. GDE. He/him 🏳️‍🌈
May 24, 2023 20 tweets 7 min read
How I typically test performance (a thread for a client who asked about this): 1️⃣ When I’m optimizing Core Web Vitals, I typically focus on LCP and CLS. LCP is roughly “how quickly the page renders”, CLS is “how much the page jumps during loading”.

I don’t normally focus on FID because it’s almost always green (but that will change next year). Image
Apr 5, 2023 12 tweets 5 min read
Ever read an article that says “setTimeout(..., 0) fires not in 0 ms but in 4”? This is no longer true – at least not in Chrome and Safari, and not since a few months ago.

But getting there was a bit of a bumpy road. Image 1) The HTML spec tells that `setTimeout()` calls nested 5+ levels deep must be throttled to 4 ms. This prevents poorly written sites from over-consuming CPU.

(Note the word “nested” – unnested `setTimeout()`s were never intended to be throttled! But we’ll get to that in a bit.) Image
Jun 15, 2022 5 tweets 2 min read
Gah I’m really excited about <Suspense> and hydration in React 18.

With React 16-17, `.hydrate()` is often the most expensive JS call in the whole app. You start hydrating the app – and the page freezes for, like, a second: Image 
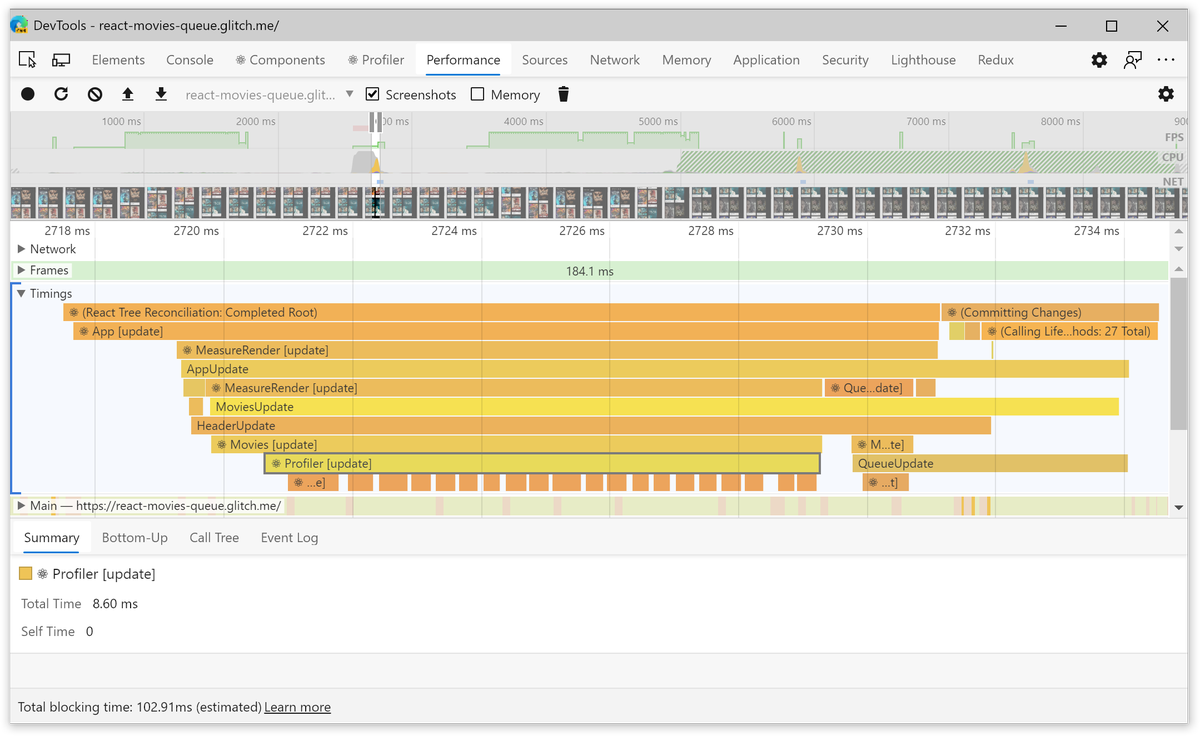
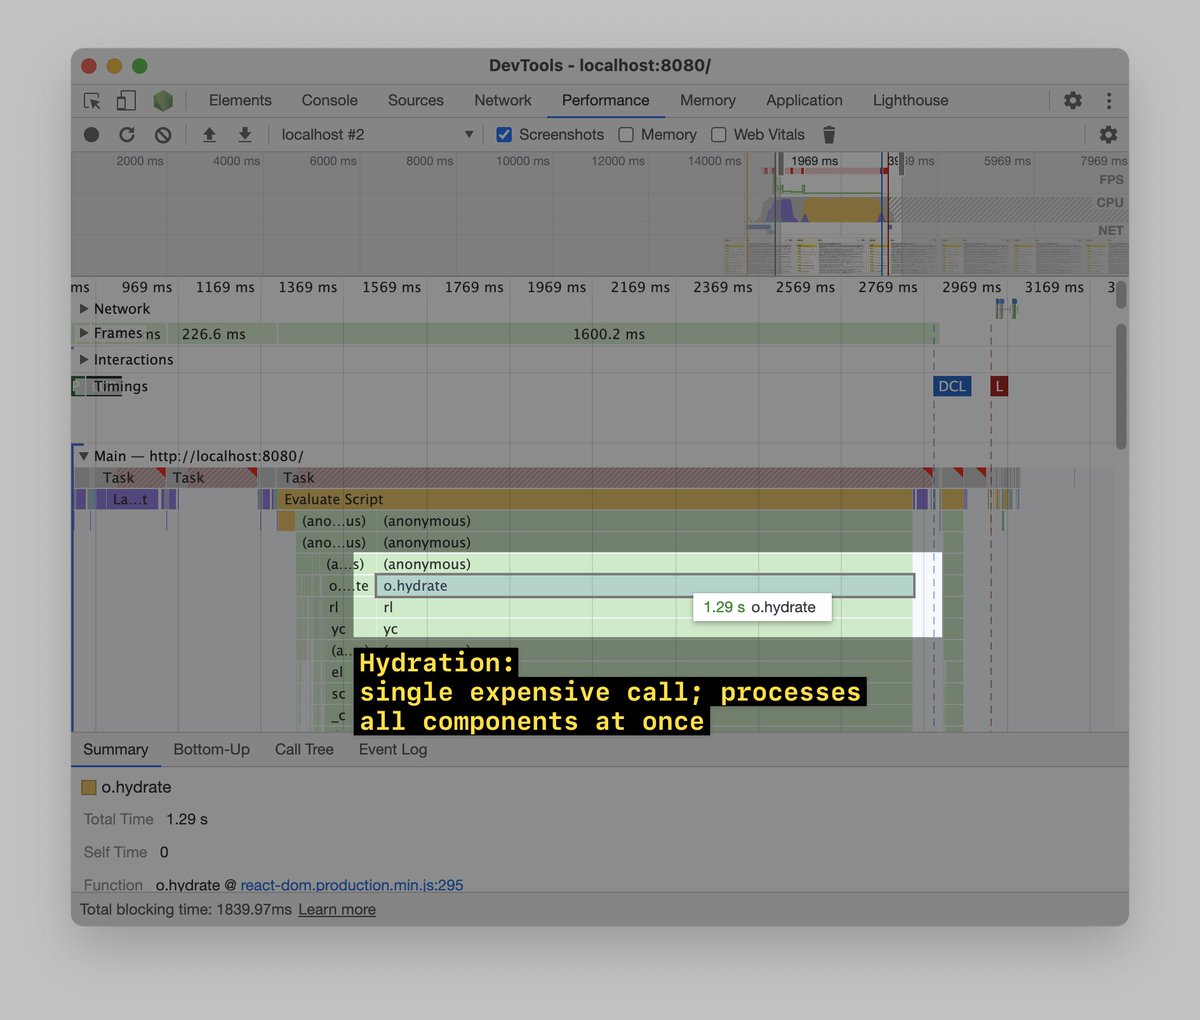
In React 18, `.hydrate()` is still expensive by default.

But! If you wrap parts of the app (or the whole app) with <Suspense>, React will take these parts – and instead of hydrating them in one go, will hydrate them in chunks, 5-10 ms at a time: Image
May 5, 2022 16 tweets 5 min read
Oh look, my favorite app Spotify being slow!

Also it’s 1 am meaning it’s the best time to do some performance profiling.

Thread ⬇️ Spotify is an Electron app, meaning we can use Chrome DevTools to profile it. To enable Chrome DevTools in Spotify, I install `spicetify` and run `spicetify enable-devtools`.

Yay!
Mar 18, 2021 11 tweets 7 min read
Thread of my favorite web performance tools 🚀 1) slowfil.es by @csswizardry and @RyanTownsend gives you a URL with a huge (and customizable) server response time.

Super convenient to test what happens when a CSS or JS files takes forever to load. Image
Nov 25, 2020 10 tweets 3 min read
Okay, let’s talk about reexports – and why they’re bad for loading and runtime performance.

Thread ⬇️ A screenshot of a file call... 
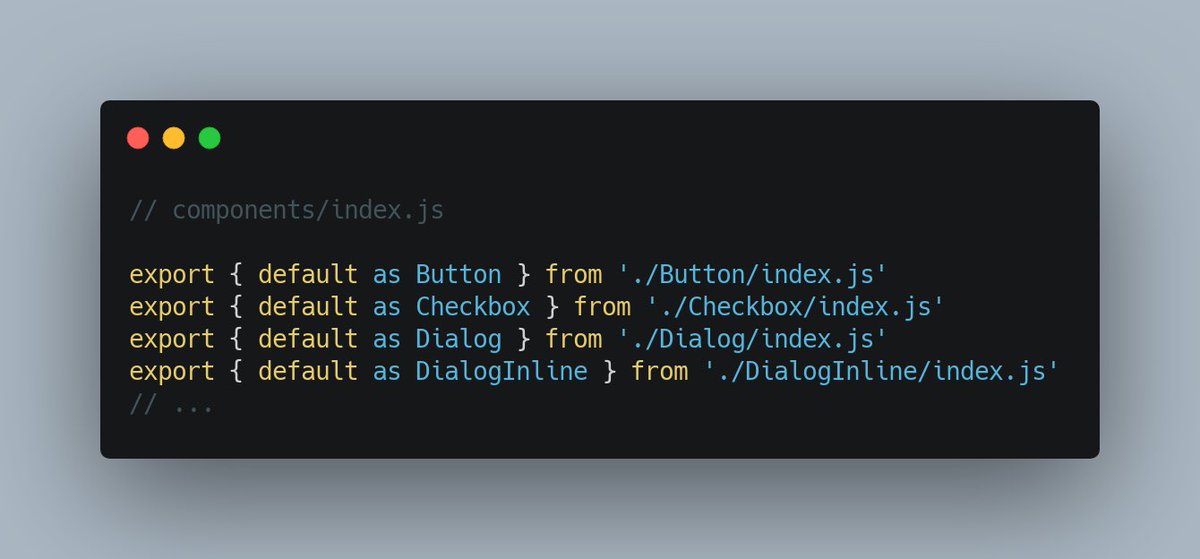
A pattern I see pretty often is when a single file re-exports stuff from lots of other files.

If your project has a `components/index.js` file which re-exports all your components (and does nothing else), that’s one example.

This is bad for performance – for two reasons.
Oct 5, 2020 10 tweets 3 min read
One of the reasons your Lighthouse score might be bad is third parties.

Many (not all, though!) third parties execute a lot of JavaScript. This blocks the main thread & worsens your JS-related Lighthouse metrics (TTI/TBT).

Here’re several ways to optimize them – a thread ⬇️ 1) Check if all third parties are needed

Sometimes, we add an analytics script, experiment with it, and then forget to remove it.

Go to DevTools → Network, filter away your domain, then go over “Domains” and see if there’s anything you (or the marketing team) don’t recognize. Image
Jun 24, 2020 68 tweets 28 min read
Okay, let’s do a thing!

One like of this tweet = one web perf tip. Loading perf, runtime perf, whatever ⬇ 1) If you do a perf recording of a React app (in the dev mode), the perf trace will include the Timings section.

In Timings, you can see what components were rendered, and when. Useful to debug unnecessary renders: Image